GE H
EALTHCARE
D
IRECTION
FQ091013, R
EVISION
1
V
IVID
I
N
AND
V
IVID
Q
N S
ERVICE
M
ANUAL
Chapter 7 - Diagnostics/Troubleshooting
7-59
NOTE:
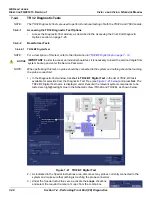
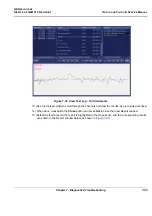
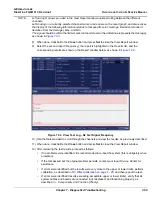
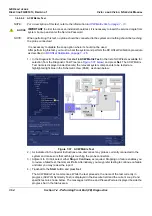
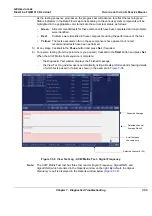
Left and right arrows provided in the View Report window enable scrolling between the different
channels.
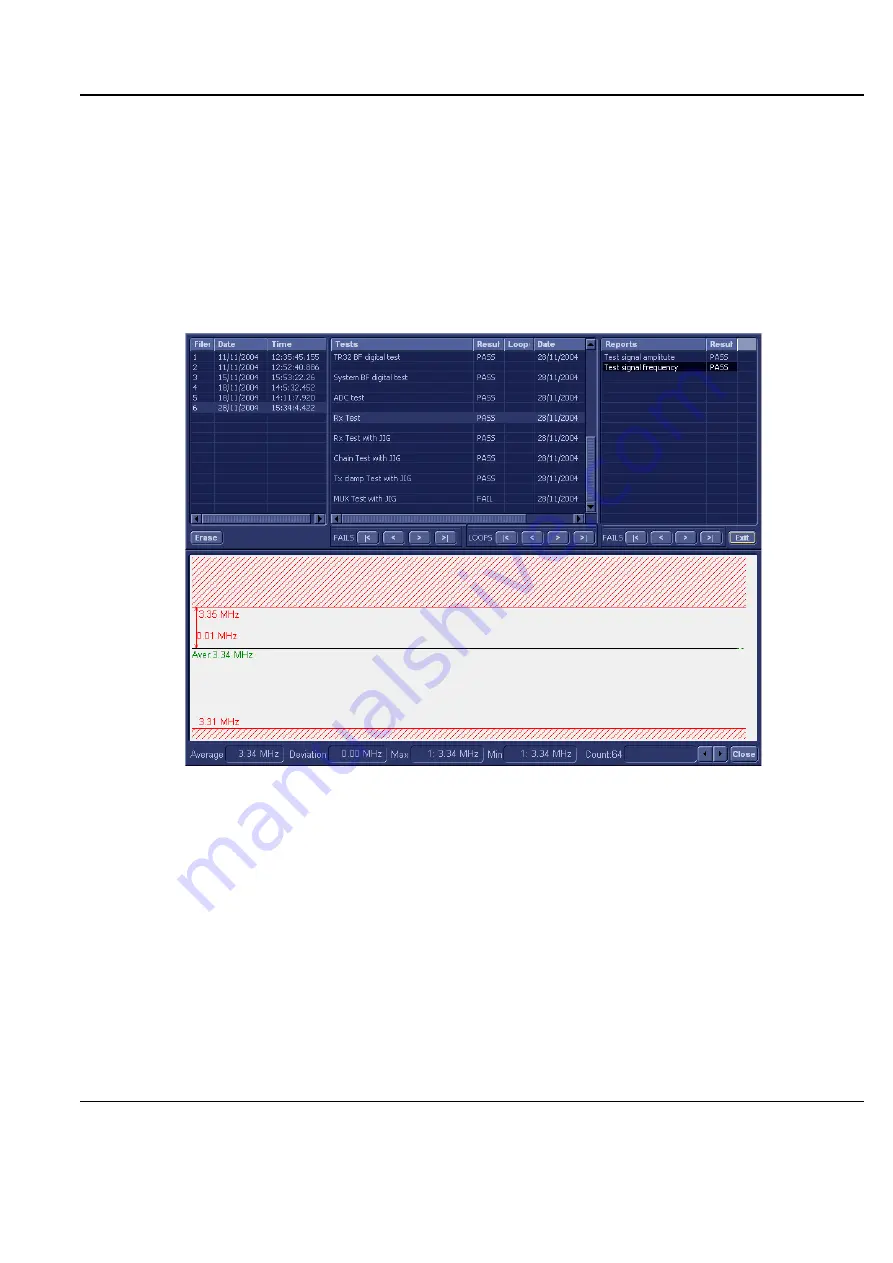
Left-clicking on a currently-selected channel marks a red square on the report graph, and also evokes
the display of the following information relative to that specific point: Average, Deviation (standard
deviation from the Average), Max, and Min.
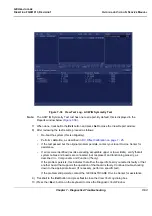
The signal should be within the limits marked in the white area (the dotted line represents the Average),
as shown in
.
8) When done, trackball to the
Close
button and press
Set
to close the View Report window.
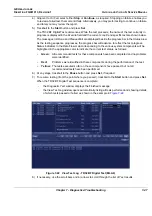
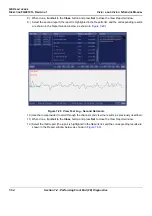
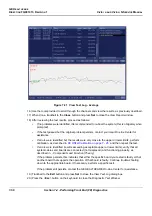
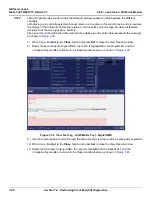
9) Select the second report (
Frequency
); the report is highlighted in the
Reports
list, and the
corresponding results are shown in the Report window below, as shown in
10.)Use the tools provided to scroll through the channels and view the results, as previously described.
11) When done, trackball to the
Close
button and press
Set
to close the View Report window.
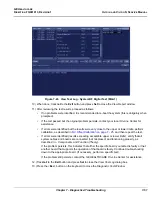
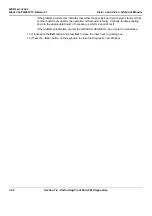
12) After reviewing the test results, proceed as follows:
•
If no problems were identified, it is recommended to re-boot the system (this is obligatory when
prompted).
•
If the test passed but the original problem persists, contact your local On-Line Center for
assistance.
•
If errors were identified but the results were very close to the upper or lower limits, perform
calibration, as described in
DC Offset Calibration on page 7 - 25
, and then repeat the test.
•
If errors were identified (results exceeding acceptable upper or lower limits), verify that all
system cables and boards are connected (not misplaced) and functioning properly, as
described in
- Components and Function (Theory).
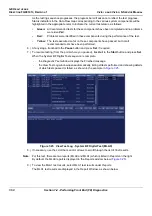
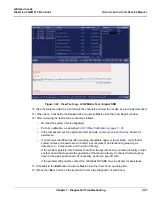
Figure 7-34 View Test Log - Rx Test Signal Frequency
Содержание FL000090
Страница 2: ......
Страница 30: ...GE HEALTHCARE DIRECTION FQ091013 REVISION 1 VIVID I N AND VIVID Q N SERVICE MANUAL xxviii ...
Страница 739: ......


