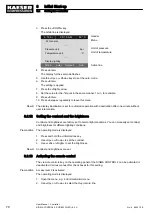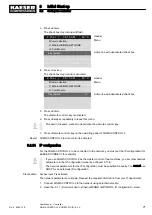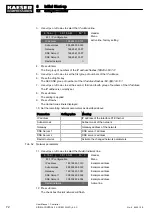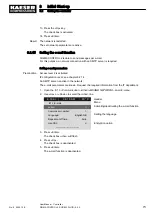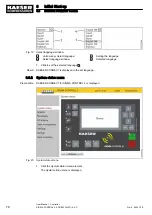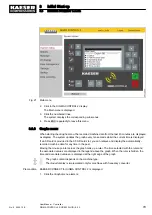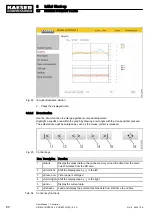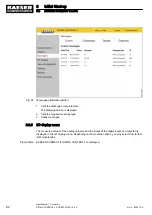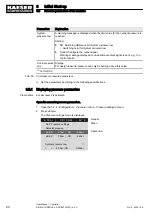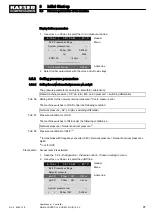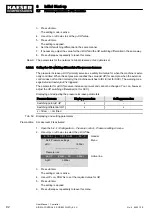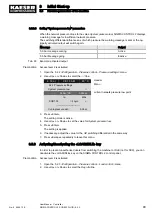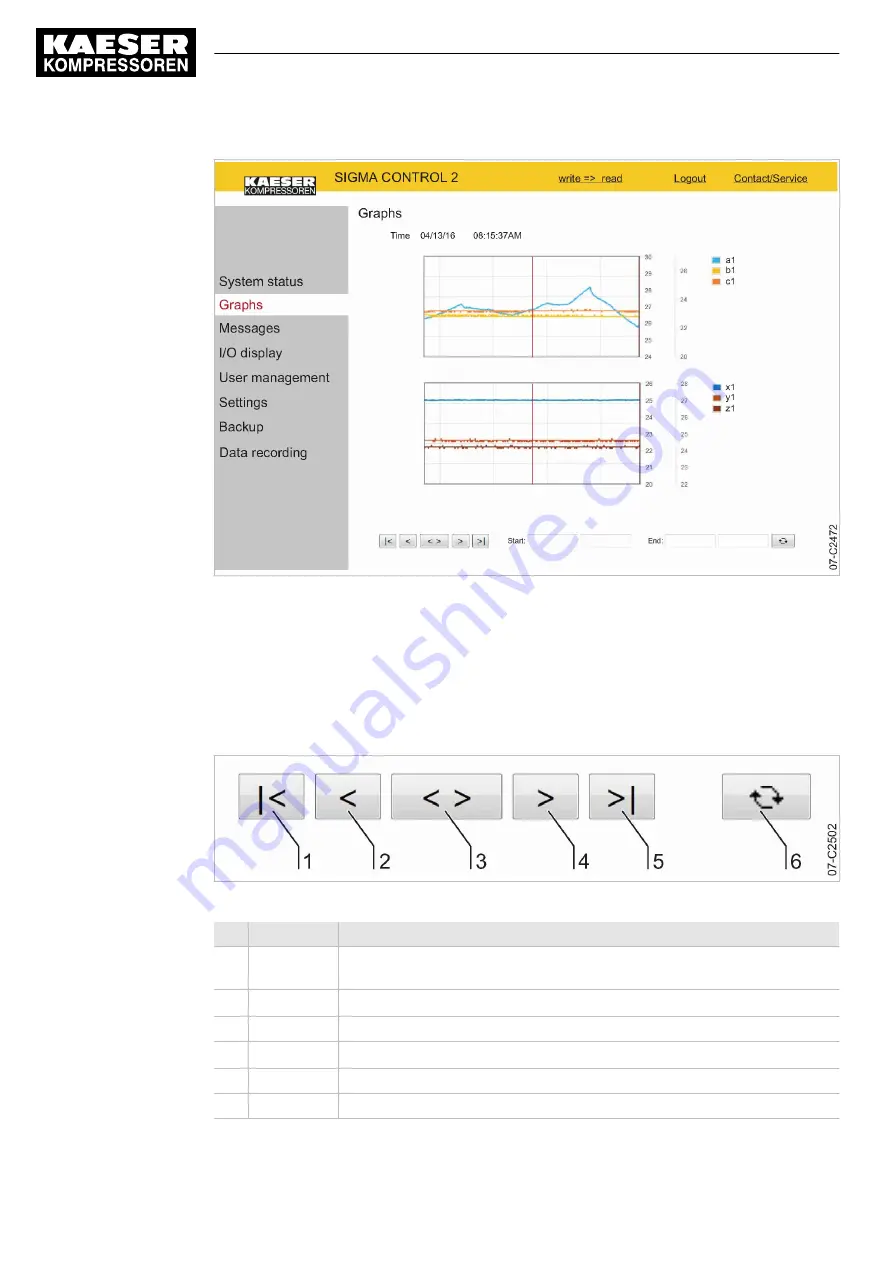
Fig. 22
Graphs (illustration similar)
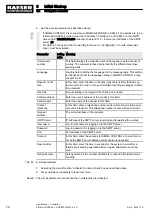
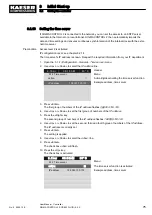
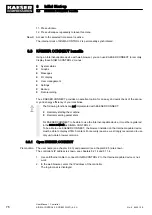
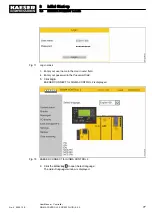
2. Check the displayed data.
8.3.3.1 Zoom function
Use the Zoom function to enlarge significant curve developments:
Highlight a specific area within the graph by drawing a rectangle with the mouse pointer pressed.
The selected area will be enlarged as soon as the mouse pointer is released.
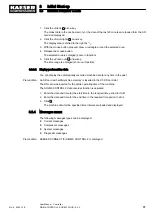
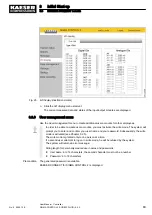
Fig. 23 Control keys
Item Description Function
1
«Start»
Display the oldest data in the cache memory or load the data from the previ‐
ous 20 minutes from the SD card
2
«Scroll left» Shift the display area by
1
/
3
to the left
3
«Zoom-out» Time range is enlarged
4
«Scroll right» Shift the display area by
1
/
3
to the right
5
«End»
Display the current data
6
«Refresh»
Load and display the entered machine data from start time to end time
Tab. 54 Control key functions
8
Initial Start-up
8.3
KAESER CONNECT benefits
80
User Manual Controller
SIGMA CONTROL 2 SCREW FLUID ≥5.0.X
No.: 9_9450 12 E

