


2301D/2301D-EC Digital Control
Manual 26247
48
Woodward
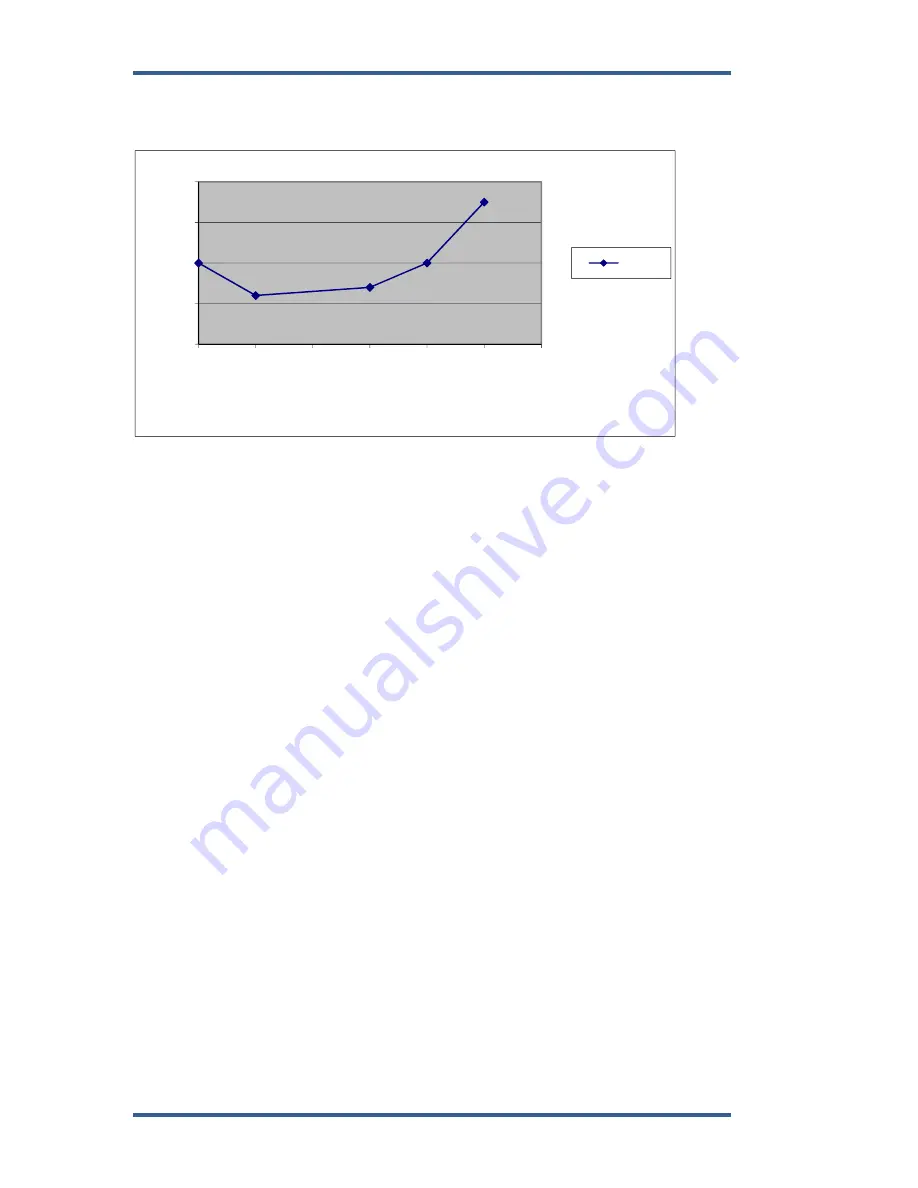
Note that in both charts the valve position falls on a curve. The menu does not permit
the construction of a curve. However, with four slope segments (5 break points)
available, a rough approximation of the curve can be created (see Figure 3-7).
Figure 3-7. Linearized Gain Plot
Diesel Engine Setup
Most Diesel engine fuel controls are nearly linear. The dynamics maps may still
be used to accommodate non-linear conditions caused either by the fuel system
or by linkage between the actuator and the rack. For gain settings that are not
used, set the associated breakpoint at 100%.
Control Gain Programming Steps
1. Gain programming is needed whenever the gain of the engine and fuel
system is non-linear. This usually occurs in gas engine applications. A plot of
the fuel system must be determined to properly adjust the gain of the control
to match the gain of the system at all loads.
The plot reflects the actuator output, as seen in A**DISPLAY MENU**,
versus the engine load as load is varied from no load to full load.
To construct a gain plot:
a.
Set the Gain A breakpoint for 100%. This ensures that there will not be any
confusion with other settings while plotting the system characteristics. Only
Gain A, Reset, and Actuator Compensation will be used.
b.
Start the engine and obtain good control at no load using Gain A, Stability,
and Actuator Compensation. Record these settings and the actuator output
as displayed in A**DISPLAY MENU**.
c.
Load the engine with as many load points as are practical. At each load point,
Gain A may need to be varied to maintain engine stability. Do not change
Reset or Actuator Compensation after the first setting in step b. Should it be
necessary to change these settings to obtain good control, repeat all previous
steps until only Gain is changed at each load step. At each load point, record
the Fuel Demand % that is displayed in A**DISPLAY MENU**. Also record
the engine load (KW) and Gain A at each point. If KW percent is selected for
the X axis of the curve, the ratio of KW to Rated KW times 100 will be used as
the load percent value. The actuator bump feature can be used to make small
fuel changes about the load point to verify stability.
0
1
2
3
4
0
20
40
60
80
100
120
PID G
a
in
Fuel Demand
Series1
Содержание 2301D
Страница 12: ...2301D 2301D EC Digital Control Manual 26247 4 Woodward Figure 1 1a 2301D Outline Drawing Ordinary Locations ...
Страница 13: ...Manual 26247 2301D 2301D EC Digital Control Woodward 5 Figure 1 1b 2301D Outline Drawing Hazardous Locations ...
Страница 14: ...2301D 2301D EC Digital Control Manual 26247 6 Woodward Figure 1 2a 2301D Plant Wiring Diagram sheet 1 ...
Страница 16: ...2301D 2301D EC Digital Control Manual 26247 8 Woodward Figure 1 2c 2301D Plant Wiring Diagram notes ...
Страница 51: ...Manual 26247 2301D 2301D EC Digital Control Woodward 43 Figure 3 4 Typical Transient Response Curves ...
Страница 127: ...Manual 26247 2301D 2301D EC Digital Control Woodward 119 ...
Страница 129: ...Declarations ...