228
Nexam Pro User Manual
Chapter 13
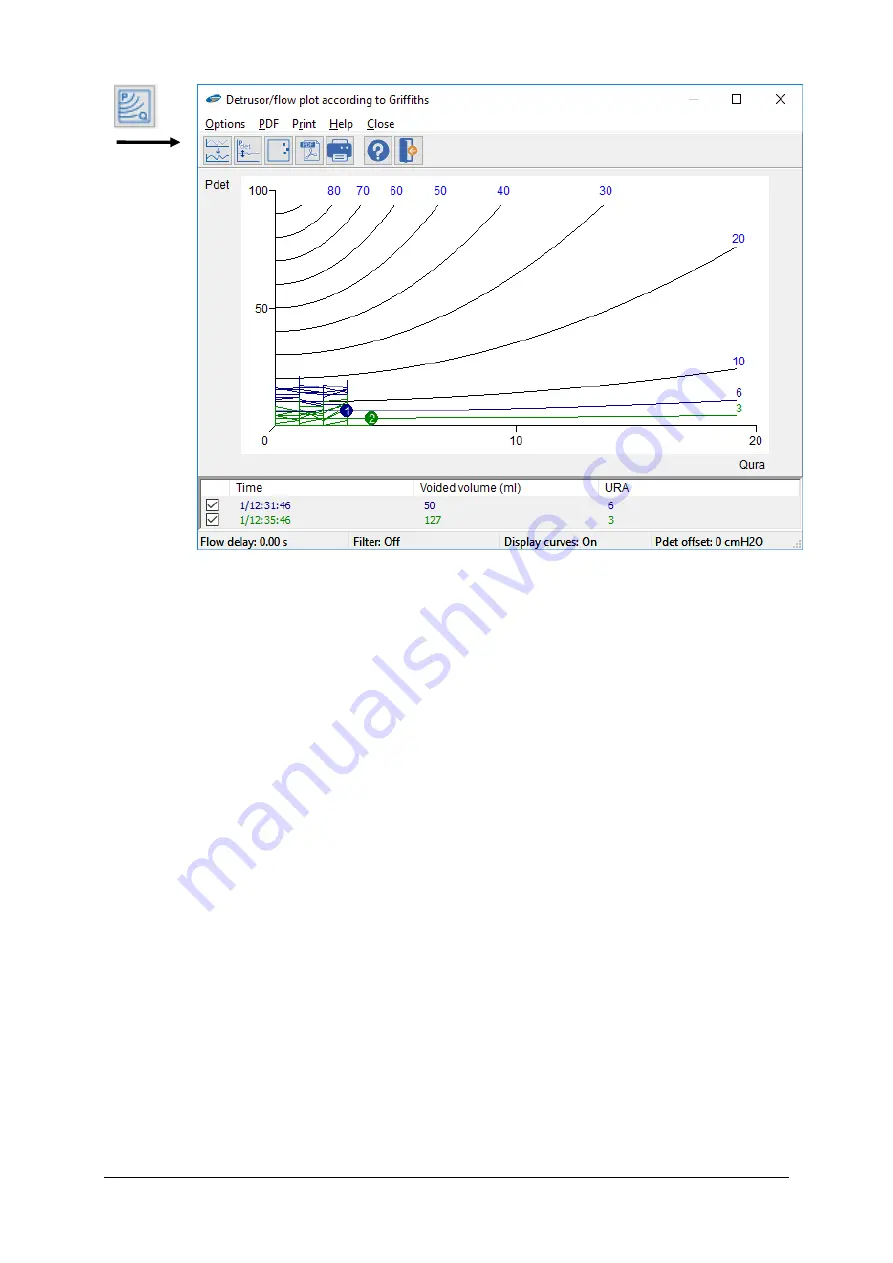
Figure 13.12
Griffiths Detrusor/flow plot
The black curves in the Griffiths detrusor-flow plot show values of URA. URA
is a urethral resistance factor. The URA of a patient is determined by the point
representing the peak flow and the detrusor pressure at peak flow for one
micturition. The URA of the micturition shown in the figure above is 8. Values
of URA above about 27 cm H
2
O correspond roughly to obstruction.
Read also:
D. Griffiths et al. (1989): Quantification of urethral resistance and bladder
function during voiding, with special reference to the effects of prostate size
reduction on urethral obstruction due to BPH,
Neuro-urology and urodynamics
8:17-27 (1989).
13.5.8 Schäfer Detrusor/Flow plot
The Schäfer detrusor-flow plot shows an x-y plot of detrusor pressure related
to the flow. It serves as an aid for diagnosing bladder outlet obstruction.
Click the
Det/flow plot (Schäfer)
button or choose
Options >
Schäfer
Detrusor/flow plot
from the menu to display the plot.
Содержание Nexam Pro CIM
Страница 1: ...Nexam Pro User Manual...


