Output Power vs. Resistance Graphs
T
e
chnical S
pecifications
Force EZ-C Series Service Manual
4-17
Output Power vs. Resistance Graphs
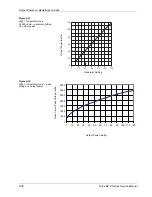
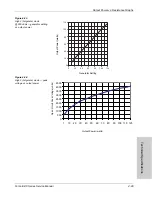
The graphs that follow depict the changes for each mode at specific power
settings.
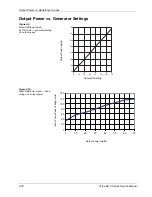
Bipolar Graph
The insulating surface described in IEC 60601-2-2 and full length leads was used
to obtain the bipolar output measurements.
Figure 4-1.
Standard Bipolar mode — load
resistance vs. output power
Load Resistance (ohms)
Ou
tpu
t Powe
r
(wa
tt
s
)
0
200
400
600
800
1000
1200 1400
1600 1800 2000
100
90
80
70
60
50
40
30
20
10
0
70 W
30 W


