


uREG User Manual
82
For units equipped with a color
GH/GV
graphic display, viewing event reports has three
options:
1.
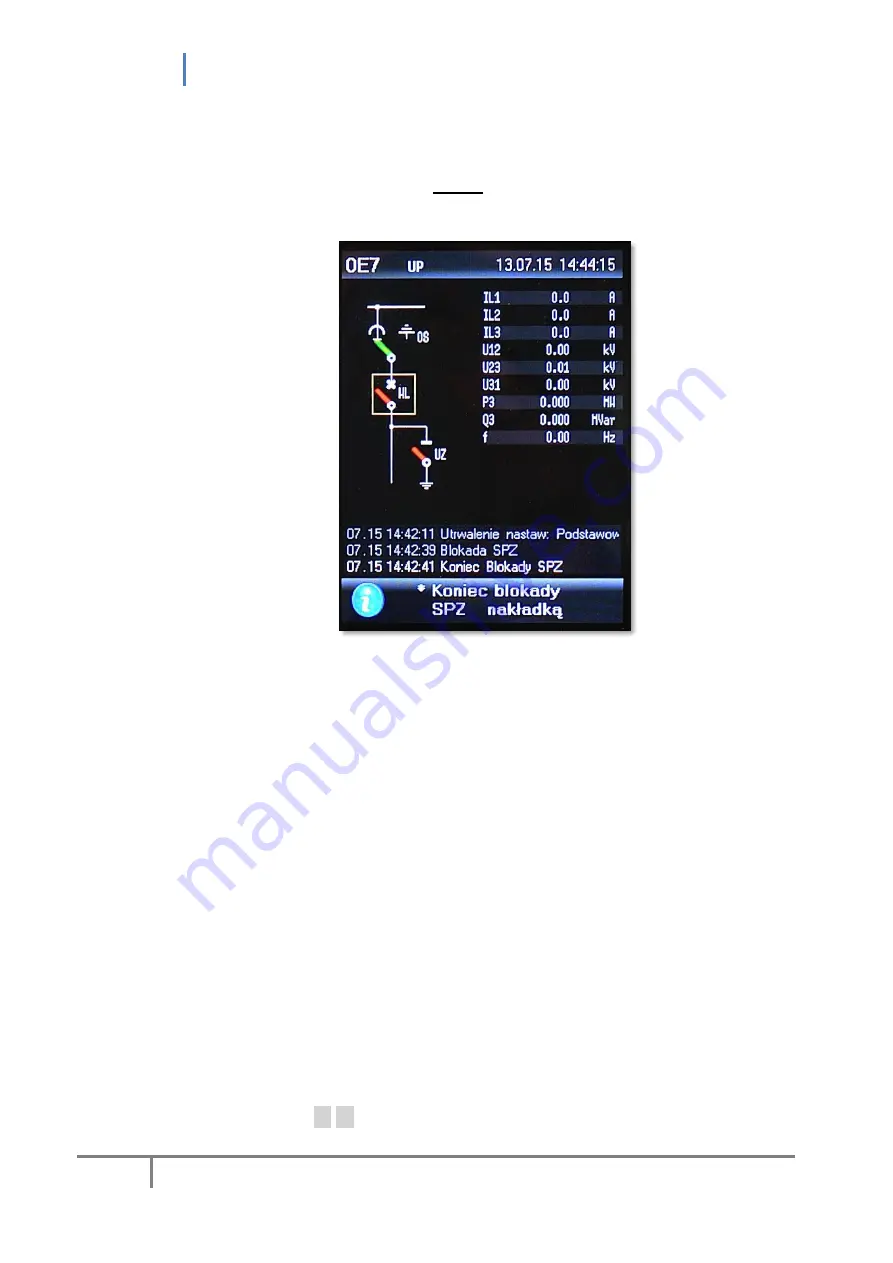
Three last
(earliest) reports are always presented on the main screen, whereas
the last report is always highlighted, e.g.:
Fig. 14.1. Reports on the main screen of graphic panels.
This mode of report presentation has the following format:
mm.dd gg:mm:ss report extended description
where
mm.dd
– month.day,
gg:mm:ss
– hours.minutes.seconds.
2.
Report viewing through the menu structure [ident 6 ‘
Reports
’]. Report
presentation is similar to the mode of NV panels, i.e.:
report no.;
event code (as a hexadecimal index, e.g. DNP-3);
time marker given as date and time when recorded (for milliseconds);
microsecond extension of the time marker (accuracy up to 100 us),
and additionally:
extended report description (the so-called extended report).
Example:
09.0112:11.06.01 12:32:24.331 4
W2 low state
→ report no. 9, code 0112h = 274, date 2011.06.01, hour 12:32:24.331 + 400us.
Viewed reports are displayed in yellow.
3.
Report viewing through
Event reports
in
Mini-Monitor
mode.
Max. 63 reports can be displayed (from the last auxiliary power-up). Reports can be
scrolled by pressing
▼ ▲
. Report presentation is given in the table form (8 pcs) with
the format discussed in → 2.
Summary of Contents for uREG
Page 2: ...uREG User Manual 2 LogCZIP and uREG are registered trademarks of REGULUS Zygmunt Liszy ski...
Page 4: ...uREG User Manual 4...
Page 8: ...uREG User Manual 8 21 GUIDELINES FOR THE PURCHASER 107 22 WARRANTY 107...
Page 21: ...uREG User Manual 21 Drilling diagram for 10 slot enclosure installation...
Page 22: ...uREG User Manual 22 Drilling diagram for 14 slot enclosure installation...


