34
FMS 1 - Fluorescence Monitoring System
© 2017 Hansatech Instruments Ltd
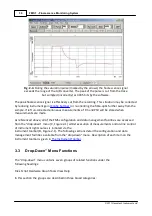
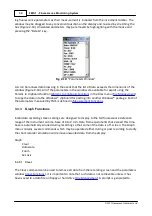
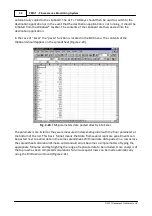
log fluorescence parameters as their measurement is initiated from the instrument toolbar. The
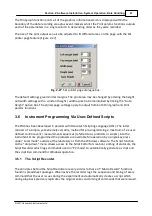
window may be dragged to any convenient position on the display and re-sized by stretching the
box (Figure 2-10). Unwanted parameters may be removed by high-lighting with the mouse and
pressing the “Delete” key.
Fig. 2-10
. “Parameters Window”
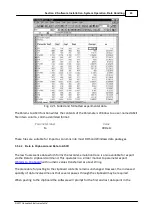
A scroll bar allows data browsing in the event that the list of data exceeds the dimensions of the
window (Figure 2-10). All of the parameters in the window are available for export using the
Params to clipboard function (
) in the Files menu (
to copy the data into the Windows® clipboard for pasting into another Windows® package. Each of
the parameters measured by FMS is defined in
3.3.3
Graph Functions
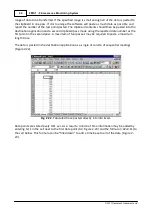
Initial data recording screen settings are designed to display to the full fluorescence detection
range of the instrument on time-base of 0 to 2 min. Data from experiments that exceed this time-
base is automatically scrolled during recording so that some of the data is off-screen. The Graph
menu contains several commands which may be operated either during or post recording to clarify
the chart-recorder emulation and remove unwanted data from the display.
Graph
Clear
Autoscale
Zoom
Set axis
3.3.3.1
Clear
The Clear command can be used to remove all data from the recording screen and the parameters
window (
). It is important to note that such data is not retrievable unless it has
been saved to a data file on floppy or hard drive (
. A prompt is generated to
Summary of Contents for FMS1
Page 1: ......
Page 7: ...Section 1 Measurement Principles and Hardware ...
Page 21: ...Section 2 Software Installation System Operation Data Handling ...
Page 70: ...70 FMS 1 Fluorescence Monitoring System 2017 Hansatech Instruments Ltd ...
Page 71: ...Section 3 Stand Alone Instrument Operation and Data Upload ...
Page 83: ...83 Section 3 Stand Alone Instrument Operation and Data Upload 2017 Hansatech Instruments Ltd ...

