35
Section 2: Software Installation, System Operation, Data Handling
© 2017 Hansatech Instruments Ltd
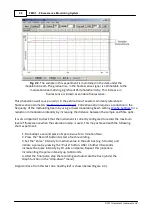
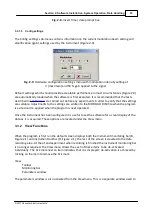
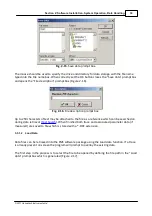
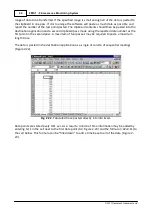
remind the user each time the command is used (Figure 2-11).
Fig. 2-11
. Clear trace prompt
3.3.3.2
Autoscale
The Autoscale function re-sets both fluorescence and time axis to accommodate all of the
currently recorded data on a single screen. It may be used at any time after a recording to “un-
scroll” the chart-recorder emulation.
3.3.3.3
Zoom
After selecting the zoom function the mouse cursor should be moved to the area of interest in the
data recording area. The left mouse button should be held down whilst the area to be zoomed is
defined by dragging the cursor across the data recording area. A box is generated to outline the
area of the zoom before it is enlarged to fill the data recording area.
3.3.3.4
Set Axis
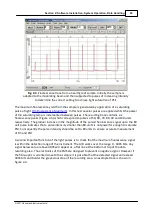
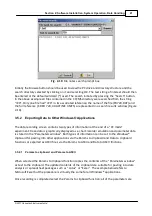
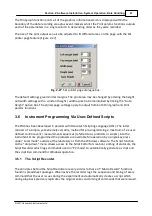
Manual control over axis setting and other plotting attributes are accessed via the Set axis sub-
menu (Figure 2-12).
Fig. 2-12.
Axis settings menu. The fluorescence axis set over the range 0 to 5000 bits
with recording from time zero to 5 min. A solid trace is selected with 10 gridlines per
axis.
Summary of Contents for FMS1
Page 1: ......
Page 7: ...Section 1 Measurement Principles and Hardware ...
Page 21: ...Section 2 Software Installation System Operation Data Handling ...
Page 70: ...70 FMS 1 Fluorescence Monitoring System 2017 Hansatech Instruments Ltd ...
Page 71: ...Section 3 Stand Alone Instrument Operation and Data Upload ...
Page 83: ...83 Section 3 Stand Alone Instrument Operation and Data Upload 2017 Hansatech Instruments Ltd ...


