9
Section 1: Measurement Principles and Hardware
© 2017 Hansatech Instruments Ltd
Consequently measurement of changes in the extent of fluorescence emission with FMS can be
used to infer information about changes in the efficiency of light use for photochemistry
(Reviewed in Krause and Weis 1991 and Govindjee 1995)
Since the work of Emerson et al. (1932) it has been widely accepted that there are two separate
photochemical steps during photosynthesis which are associated with different groups of
pigments; these groups have become known as photosystem I and photosystem II. In practice
differences in the functionality of photosystem I and II mean that at least 95% of the chlorophyll
fluorescence signal observed under physiological temperatures is derived from chlorophyll
molecules associated with
photosystem II (PSII). Hence the fluorescence signal detected by FMS reflects changes in the
efficiency with which absorbed light is used for PSII photochemistry.
2.1.2
How does the FMS measure chlorophyll fluorescence?
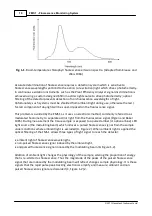
At physiological temperatures peak fluorescence emission occurs in the red region of the
spectrum ( 685 nm) and extends into the infra-red region to around 800 nm (Krause and Weiss
1984) (Figure 1-1).
Summary of Contents for FMS1
Page 1: ......
Page 7: ...Section 1 Measurement Principles and Hardware ...
Page 21: ...Section 2 Software Installation System Operation Data Handling ...
Page 70: ...70 FMS 1 Fluorescence Monitoring System 2017 Hansatech Instruments Ltd ...
Page 71: ...Section 3 Stand Alone Instrument Operation and Data Upload ...
Page 83: ...83 Section 3 Stand Alone Instrument Operation and Data Upload 2017 Hansatech Instruments Ltd ...


