44
FMS 1 - Fluorescence Monitoring System
© 2017 Hansatech Instruments Ltd
range of data to be transferred. If the specified range is small enough all of the data is pasted to
the clipboard in one pass. If it is too large the software will paste as much data as possible and
report the number of the last point pasted. The clipboard contents should then be pasted into the
destination application and a second clipboard pass made using the reported data number as the
first point in the second pass. A maximum of four passes may be required to paste a maximum
length trace.
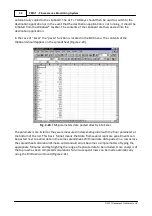
The data is pasted in the destination application as a single of column of sequential readings
(Figure 2-22).
Fig. 2-22.
Tabulated trace pasted directly into into Excel.
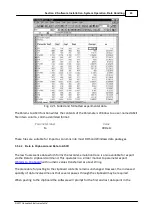
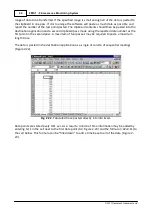
Data points are stored every 0.11 sec. As a result a column of time information may be added by
entering 0.11 in the cell next to the first data point (A2, Figure 2-23) and the formula (=A2+0.11) to
the cell below. This formula can be “filled down” to add a time-base to all of the data (Figure 2-
23).
Summary of Contents for FMS1
Page 1: ......
Page 7: ...Section 1 Measurement Principles and Hardware ...
Page 21: ...Section 2 Software Installation System Operation Data Handling ...
Page 70: ...70 FMS 1 Fluorescence Monitoring System 2017 Hansatech Instruments Ltd ...
Page 71: ...Section 3 Stand Alone Instrument Operation and Data Upload ...
Page 83: ...83 Section 3 Stand Alone Instrument Operation and Data Upload 2017 Hansatech Instruments Ltd ...

