42
FMS 1 - Fluorescence Monitoring System
© 2017 Hansatech Instruments Ltd
automatically copied to the clipboard. The ALT + TAB keys should then be used to switch to the
destination application or in the event that the destination application is not running, it should be
initiated from the Windows® taskbar. The contents of the clipboard are then pasted into the
destination application.
In the case of “Excel” the “paste” function is located in the Edit menu. The contents of the
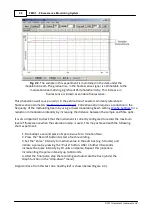
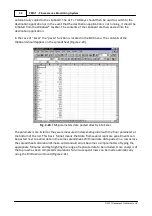
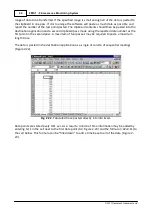
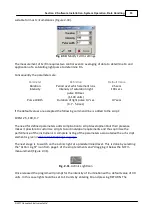
clipboard should appear on the spreadsheet (Figure 2-20).
Fig. 2-20
. FMS parameters data pasted directly into Excel.
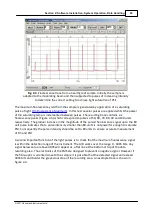
The parameters are listed as they were measured in descending order with the final parameter at
the bottom of the list. This basic format means that data from several replicate experiments can
be pasted next to earlier data in the same spreadsheet. With replicate data pasted in a row across
the spreadsheet calculation of mean and standard errors becomes a simple matter of typing the
appropriate formulae and high-lighting the range of replicate data to be included. Once analysis of
the top row has been completed calculations for all susequent rows can be made automatically
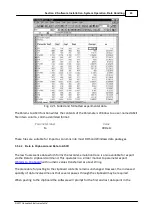
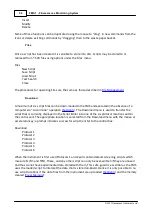
using the Fill Down command (Figure 2-21).
Summary of Contents for FMS1
Page 1: ......
Page 7: ...Section 1 Measurement Principles and Hardware ...
Page 21: ...Section 2 Software Installation System Operation Data Handling ...
Page 70: ...70 FMS 1 Fluorescence Monitoring System 2017 Hansatech Instruments Ltd ...
Page 71: ...Section 3 Stand Alone Instrument Operation and Data Upload ...
Page 83: ...83 Section 3 Stand Alone Instrument Operation and Data Upload 2017 Hansatech Instruments Ltd ...

