25
Section 2: Software Installation, System Operation, Data Handling
© 2017 Hansatech Instruments Ltd
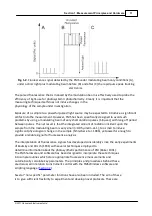
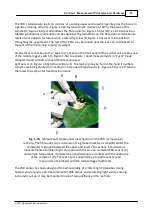
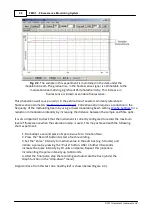
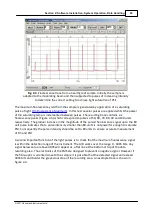
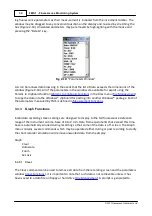
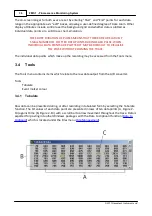
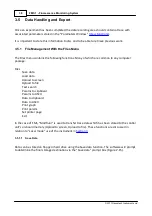
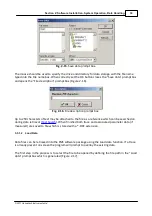
Fig. 2-1
. The data recording screen contains the data recording area (A), instrument
monitoring bar (B), “drop-down” menu bar (C) and instrument toolbar (D).
The data recording area is a graphic display area where acquired fluorescence data expressed as
output from the analogue to digital (A/D) converter in bits (Y-axis) is plotted against time (X-axis)
to give a “real-time” chart recorder emulation. Both axes may be scaled either automatically to
display all data or manually to zoom regions of particular interest via the Graph function in the
“drop-down” menu (
). The maximum range of the A/D converter is 4095 bits; the
plot area above this value is greyed-out to indicate that any output above 4095 bits is overscale
(
).
Automatic scrolling of the plot ensures that data collection is continuous up to a maximum length
of approximately 50 minutes. The PAUSE button in the instrument toolbar may be used to suspend
data collection, operating as the computer equivalent of lifting the pens off a chart recording. If
this function is used to limit data logging to specific periods of interest much longer experimental
protocols may be run.
Data is digitally displayed throughout the experiment on the instrument monitoring bar (B, Figure
2-1). Fluorescence information is continuously up-dated even when the PAUSE function is used to
suspend data logging, allowing estimation of steady state fluorescence prior to resumption of
logging during a measurement. Data from external devices such as the PAR and temperature leaf-
clip are also presented on the monitoring bar along with information relating to the status of
digital control lines. In the event that external devices are not being used it is possible to switch
off the monitoring bar via a toggle switch in the View function of the “drop-down” menu bar (
Summary of Contents for FMS1
Page 1: ......
Page 7: ...Section 1 Measurement Principles and Hardware ...
Page 21: ...Section 2 Software Installation System Operation Data Handling ...
Page 70: ...70 FMS 1 Fluorescence Monitoring System 2017 Hansatech Instruments Ltd ...
Page 71: ...Section 3 Stand Alone Instrument Operation and Data Upload ...
Page 83: ...83 Section 3 Stand Alone Instrument Operation and Data Upload 2017 Hansatech Instruments Ltd ...

