27
Section 2: Software Installation, System Operation, Data Handling
© 2017 Hansatech Instruments Ltd
Throughout the recording period individual FMS-driven illumination events are marked by arrows
to mark light on and arrows to mark light off events. User events such as herbicide treatment etc.
may be marked using the buttons on the instrument toolbar (
). All
markers tag corresponding data in the tabulated data output from FMS by colour-coding data for
easy reference (
).
The next stage in operating the FMS is to test the system with spare sample and configure the
instrument to achieve optimum performance.
3.2.3
Testing the FMS
Before running an experiment several functional aspects of the instrument should be checked:
·
The signal is sufficiently strong to be acceptable,
·
The modulation beam does not change the physiology of the sample,
·
The saturation pulse is sufficiently powerful to saturate the sample, and the maximum
fluorescence yield is within the range of the instrument.
The following section briefly describes two experiments which can be run to verify
each of these aspects on spare sample tissue.
1. Dark-adapt a piece of spare experimental tissue using the dark-adaptation clip or by
covering the sample in the PAR / temperature clip.
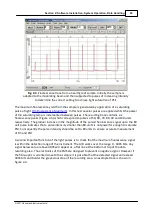
2. Start a new recording by pressing the “Record” button on the instrument toolbar. The dark-
adapted fluorescence yield should plot across the data recording area. This is the minimum
fluorescence signal from the sample and should be within the range of 10 - 700 bits for
reliable measurement. If the signal is too small the test recording should be stopped (re-press
the “Record” button) and the sensitivity of the instrument adjusted by increasing gain (
) or by moving the fire optic closer to the sample. If the signal is too great (>700 bits)
the instrument will probably over-scale when the saturating pulse is used. Instrument gain
should be reduced. This effect can also be achieved by moving the fibre-optic away from the
sample.
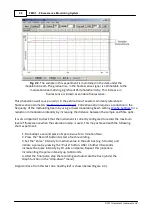
It is also important to check that the signal recorded in the experiment above remains constant. In
the example below (Figure 2-2.) the dark-adapted fluorescence signal is around 500 bits (suitable
for further measurement) but gradually increases with time. This indicates that the modulation
beam setting is too high and that it is inducing a physiological effect on the sample. The most
common symptom is a gradual rise in the fluorescence signal known as “variable” fluorescence
which occurs as the modulating beam drives a significant amount of photochemistry (
).
Summary of Contents for FMS1
Page 1: ......
Page 7: ...Section 1 Measurement Principles and Hardware ...
Page 21: ...Section 2 Software Installation System Operation Data Handling ...
Page 70: ...70 FMS 1 Fluorescence Monitoring System 2017 Hansatech Instruments Ltd ...
Page 71: ...Section 3 Stand Alone Instrument Operation and Data Upload ...
Page 83: ...83 Section 3 Stand Alone Instrument Operation and Data Upload 2017 Hansatech Instruments Ltd ...

