37
Section 2: Software Installation, System Operation, Data Handling
© 2017 Hansatech Instruments Ltd
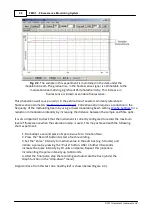
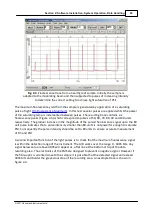
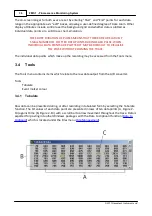
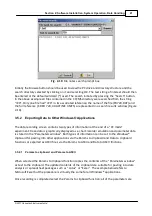
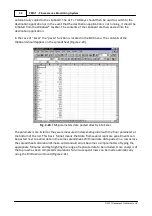
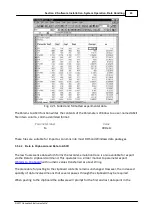
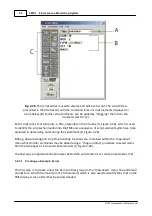
Fig. 2-13
. Tabulated output of data collected from the A/D converter. Data is
presented in rows of 10 data points (A) with the time of the first point at the start of
each line (B). Event-marked data are colour-coded for easy reference (C).
Data points which correspond to trace event marks are tagged with colour-coded labels (C, Figure
2-13). The colours associated with each type of event marker can be
defined by the user.
3.4.2
Event marker colour
The addition and removal of FMS light sources to the sample is event marked on the data
recording screen with a different coloured arrow for actinic, pulse and far-red light sources. The
default colours and data tags (in the tabulated output) for these are yellow, white and red
respectively with blue reserved for user-applied event markers. The colour of each type of marker
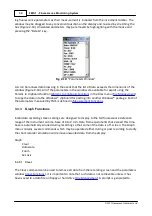
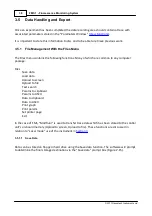
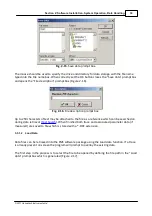
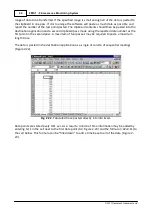
can be specified by selecting the appropriate marker type from the
sub-menu presented and double-clicking on the required colour from the palette that is generated
and selecting OK (Figure 2-14).
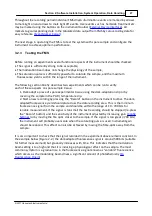
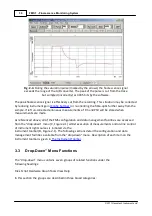
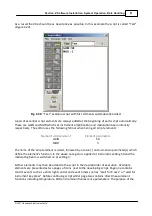
Fig. 2-14
. Paint Palette used for definition of
event marker colour.
The final colour settings in place when the program is shut-down will automatically be saved to
the MODFLUOR.INI file to become default values when the FMS is next is used.
Summary of Contents for FMS1
Page 1: ......
Page 7: ...Section 1 Measurement Principles and Hardware ...
Page 21: ...Section 2 Software Installation System Operation Data Handling ...
Page 70: ...70 FMS 1 Fluorescence Monitoring System 2017 Hansatech Instruments Ltd ...
Page 71: ...Section 3 Stand Alone Instrument Operation and Data Upload ...
Page 83: ...83 Section 3 Stand Alone Instrument Operation and Data Upload 2017 Hansatech Instruments Ltd ...

