52
FMS 1 - Fluorescence Monitoring System
© 2017 Hansatech Instruments Ltd
Script Editor is to allow the user to string individual elements together in any order, generating
complex experiments which can be operated from a single key-press on the FMS when away from
a PC or executed automatically under the Windows software.
A full description of each script element, the control events initiated with associated parameters
and the data that is measured during its operation are listed in Appendix A. It is important to
remember that each element is an independent unit and thus can be inserted in any position
within a script after the initial GAIN and MOD functions.
In this example the script for a simple light-response measurement will be created and the FMS
will be commanded to LOG all trace data to give a full chart recorder emulation of the experiment
upon return to the laboratory. The FMS will also be set to request experimental plot identification
information with the ID script element.
Once the new script file has been created (Figure 2-29) the next step is to select the ID element.
This function is added to the script by clicking on the “Page 1” tab to open the correct icon page
and moving the mouse cursor over the ID icon. After a second, a yellow box beneath the icon
automatically opens to provide further information on the icon. The element is incorporated into
the script by holding the left mouse button down and “dragging” the ID icon beneath the MOD
element in the script and releasing the left mouse button. A prompt box is generated requesting a
pair of values M,N. These can be considered as number of treatments (M) and number of
replicates (N). Thus 5,5 would denote a 25 plot experiment with 5 treatments replicated 5 times.
When entered the following line is added to the script:
ID : 5,5
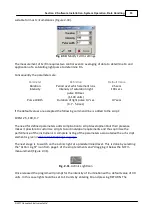
When this script is run in “Local mode” (
) the FMS will prompt each time the script is run
for a plot number. The first run the default number will be 1,1 indicating that treatment 1,
replicate 1 is to be measured. This can be accepted or an alternative plot ID entered with the keys.
The entered plot information is saved with the file at the end of the measurement and displayed in
the parameters window when the data is uploaded. When the script is executed a second time the
default plot number is automatically incremented (1,2 , 1,3 , 1,4 , 1,5 , 2,1 etc.).
The next element to add to the script is the command to LOG all of the trace data for detailed
analysis on upload. The LOG element (clipboard and pen icon) should be dragged beneath the ID
element and the parameter “1” entered into the parameter prompt box.
A LOG element with parameter “0” may be used to stop anywhere during the script. In our script
logging is required until the end of the script. Hence the following line is added:
LOG : 1
Once the set-up elements have been entered the measurement elements should be added. The
first such measurement is dark-adapted Fv/Fm. Upon addition the editor will prompt for parameter
values which define the Fv/Fm measurement, giving default numeric values which should be
Summary of Contents for FMS1
Page 1: ......
Page 7: ...Section 1 Measurement Principles and Hardware ...
Page 21: ...Section 2 Software Installation System Operation Data Handling ...
Page 70: ...70 FMS 1 Fluorescence Monitoring System 2017 Hansatech Instruments Ltd ...
Page 71: ...Section 3 Stand Alone Instrument Operation and Data Upload ...
Page 83: ...83 Section 3 Stand Alone Instrument Operation and Data Upload 2017 Hansatech Instruments Ltd ...

