45
Section 2: Software Installation, System Operation, Data Handling
© 2017 Hansatech Instruments Ltd
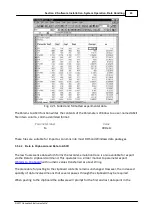
Fig. 2-23
. Time-base added to exported data.
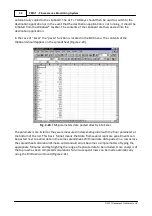
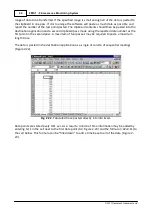
Once in this format it is simple to plot the data as an X,Y plot for presentation (Figure
2-24).
Fig. 2-24.
Data plot of signal against time using Excel “Chart-Wizard”.
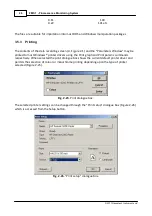
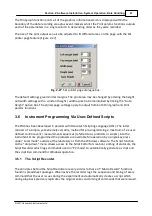
The Data to ASCII function writes all of the trace data to a user-named ASCII file in two column,
comma-delimited format:
Time of reading (sec
Signal value (bits)
Summary of Contents for FMS1
Page 1: ......
Page 7: ...Section 1 Measurement Principles and Hardware ...
Page 21: ...Section 2 Software Installation System Operation Data Handling ...
Page 70: ...70 FMS 1 Fluorescence Monitoring System 2017 Hansatech Instruments Ltd ...
Page 71: ...Section 3 Stand Alone Instrument Operation and Data Upload ...
Page 83: ...83 Section 3 Stand Alone Instrument Operation and Data Upload 2017 Hansatech Instruments Ltd ...

