ENVR208
Step 2
Select a camera.
Step 3
Select the report type as
Daily Report, Weekly Report, Monthly Report
, or
Annual Report.
Step 4
Set the
Data
to analyze.
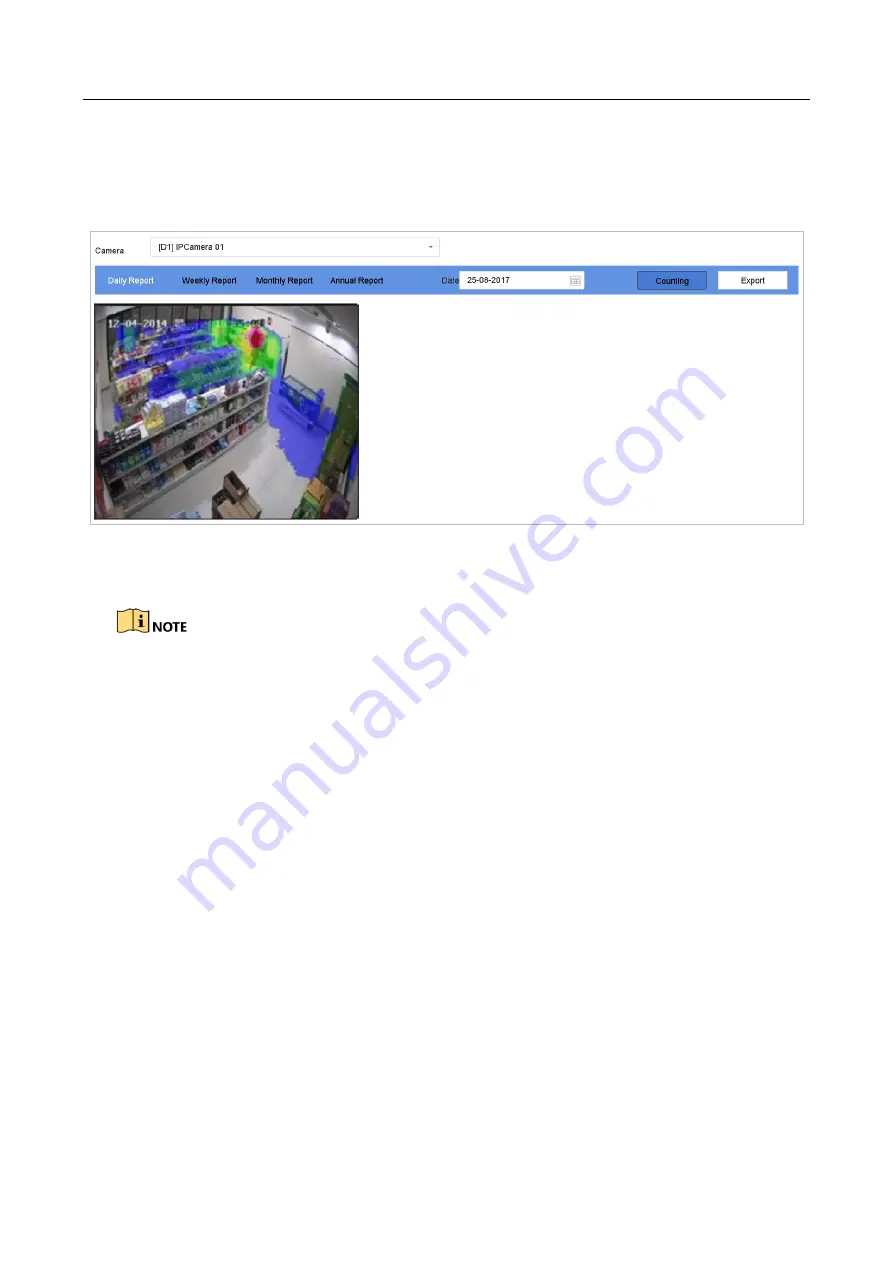
Figure 13-2
Heat Map Interface
Step 5
Click
Counting
. Then the results displayed in graphics marked in different colors will show.
As shown in the figure above, red color block (255, 0, 0) indicates the most welcome area, and blue
color block (0, 0, 255) indicates the less-popular area.
Step 6
(Optional) Click
Export
to export the statistics report in excel format.
Summary of Contents for ENVR208
Page 1: ......
Page 44: ...ENVR208 Result You can view all of the channels in one screen using the CMS or web browser ...
Page 108: ...ENVR208 Figure 11 12 Alarm Output ...
Page 131: ...ENVR208 Figure 14 8 Set Trigger Cameras of POS Step 8 Click Apply ...
Page 140: ...ENVR208 Figure 15 8 Port Settings ...
Page 167: ...ENVR208 Chapter 19 Appendix 19 1 Specifications ...


