


Appendix C Data Explorer Toolbox (Visual Basic Macros)
C-10
Applied Biosystems
C
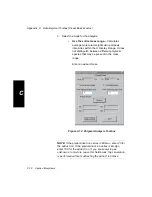
3.
Add peaks to the peak list to be included in the calculation
by typing a mass in the Add Mass to Peak List field, then
clicking Add Peak.
Remove unwanted peaks from the list that you do not
want included in the calculation by clicking the peak in the
list, then clicking Delete Selected Peaks.
4.
If you will be identifying y and b pairs, select the precursor
peak, then click Use Selected Peak.
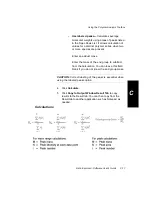
Pairs
To list ion pairs:
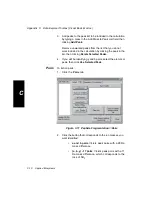
1.
Click the Pairs tab.
Figure 3-11 Peptide Fragmentation
Pairs
2.
Click the button that corresponds to the ion masses you
want identified:
•
a and b pairs
Lists peak pairs with a 28 Da
mass difference.
•
(a, b, y) –17 pairs
Lists peak pairs with a 17
Da mass difference, which corresponds to the
loss of NH
3
.
Summary of Contents for Data Explorer 4 Series
Page 1: ...Data Explorer Software Version 4 Series Software User Guide ...
Page 10: ...Table of Contents x Applied Biosystems ...
Page 56: ...Chapter 1 Data Explorer Basics 1 42 Applied Biosystems 1 ...
Page 98: ...Chapter 2 Using Chromatogram and Spectrum Windows 2 42 Applied Biosystems 2 ...
Page 172: ...Chapter 3 Peak Detection and Labeling 3 74 Applied Biosystems 3 ...
Page 204: ...Chapter 4 Examining Chromatogram Data 4 32 Applied Biosystems 4 ...
Page 270: ...Chapter 5 Examining Spectrum Data 5 66 Applied Biosystems 5 ...
Page 316: ...Chapter 6 Using Tools and Applications 6 46 Applied Biosystems 6 ...
Page 384: ...Chapter 9 Troubleshooting 9 22 Applied Biosystems 9 ...
Page 388: ...Appendix A Warranty A 4 Applied Biosystems A ...
Page 416: ...Appendix C Data Explorer Toolbox Visual Basic Macros C 20 Applied Biosystems C ...


