


Chapter 5 Examining Spectrum Data
5-60
Applied Biosystems
5
3.
Select Duplicate Active Trace from the Display menu to
keep the original data displayed after processing.
4.
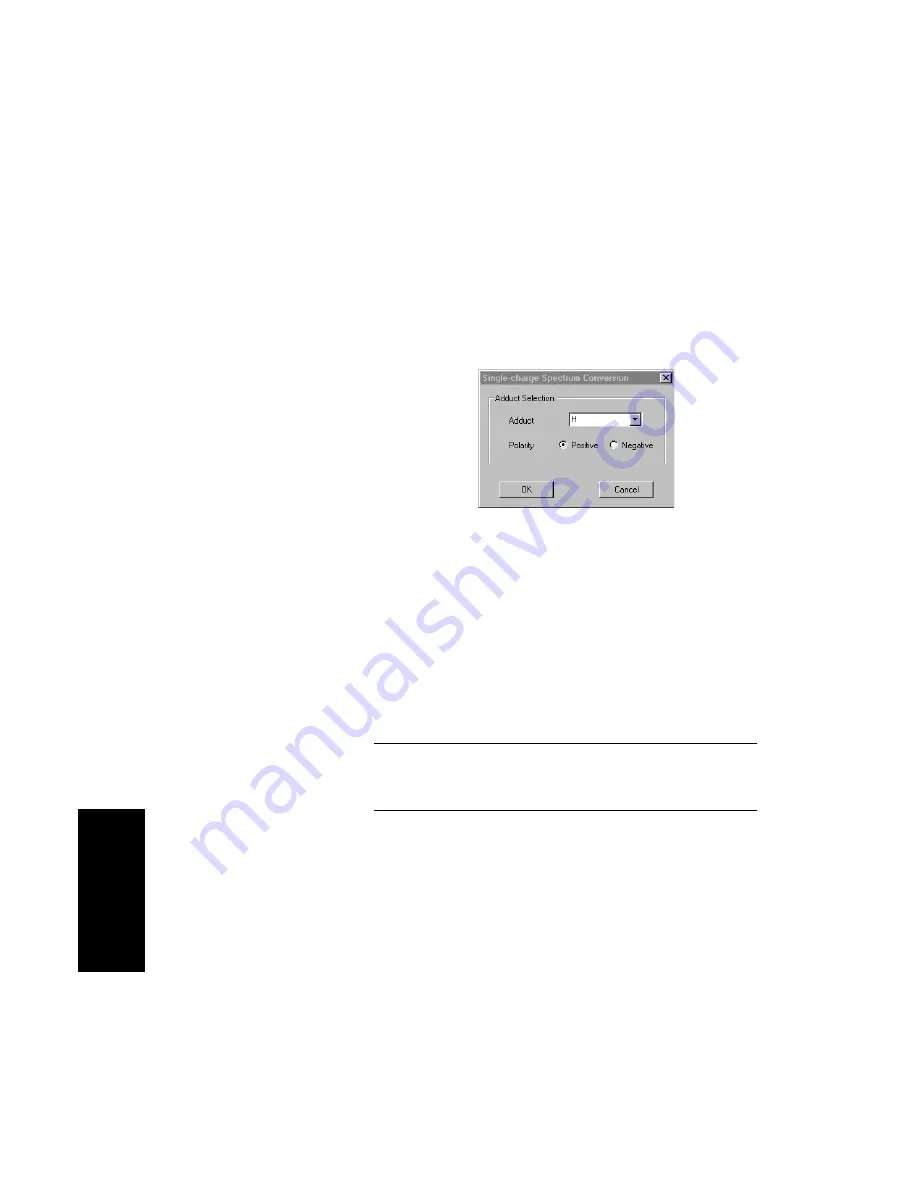
From the Process menu, select Single-Charge
Conversion.
The Single-Charge Spectrum Conversion dialog box
(Figure 5-20) is displayed.
Figure 5-20 Single-Charge Spectrum Conversion
Dialog Box
5.
In the Adduct text box, type or select the adduct that is the
charge-carrying species in the spectrum you are
examining.
6.
Select the polarity for the converted spectrum. You must
select the same charge as the spectrum you are
evaluating.
CAUTION
If you do not select the same charge as the spectrum
you are evaluating, an incorrect mass is reported.
7.
Click OK.
The converted spectrum is displayed with an SC trace
label. The height of each vertical bar corresponds to the
original peak areas.
8.
To return to the original trace, see “Returning to the
original spectrum” on page 5-3.
Summary of Contents for Data Explorer 4 Series
Page 1: ...Data Explorer Software Version 4 Series Software User Guide ...
Page 10: ...Table of Contents x Applied Biosystems ...
Page 56: ...Chapter 1 Data Explorer Basics 1 42 Applied Biosystems 1 ...
Page 98: ...Chapter 2 Using Chromatogram and Spectrum Windows 2 42 Applied Biosystems 2 ...
Page 172: ...Chapter 3 Peak Detection and Labeling 3 74 Applied Biosystems 3 ...
Page 204: ...Chapter 4 Examining Chromatogram Data 4 32 Applied Biosystems 4 ...
Page 270: ...Chapter 5 Examining Spectrum Data 5 66 Applied Biosystems 5 ...
Page 316: ...Chapter 6 Using Tools and Applications 6 46 Applied Biosystems 6 ...
Page 384: ...Chapter 9 Troubleshooting 9 22 Applied Biosystems 9 ...
Page 388: ...Appendix A Warranty A 4 Applied Biosystems A ...
Page 416: ...Appendix C Data Explorer Toolbox Visual Basic Macros C 20 Applied Biosystems C ...


