


Peak Detection
Data Explorer
™
Software User’s Guide
3-21
3
NOTE: In previous versions of Data Explorer software,
peak detection allowed you to specify Peak Width and
Noise Threshold for chromatogram data. The software now
automatically:
Uses a minimum peak width that is equal to the Filter Width,
and a maximum peak width of 10,000 data points.
Calculates the Noise Threshold by performing an automatic
signal-to-noise calculation on a chromatogram and by using
75 percent of the noise value determined as the threshold.
Filter Width
(continued)
Hint: Set Filter Width to a number equal to the number of
points across the peak. To determine the number of points
across a peak, you can change the trace display from Line to
Vertical Bars. Each vertical bar represents one data point.
For more information, see Section 1.4, Customizing the Data
Explorer Window.
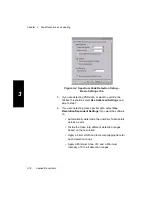
Integration Baseline Settings
NOTE: You can set peak labels to display peak start, peak end, and baseline marks.
See Section 3.5.2, Setting Chromatogram and Spectrum Peak Labels.
Valley-to-Baseline
Drops a vertical line from all valleys to a horizontal baseline.
The level of the horizontal baseline is determined using the
minimum peak valley point (left or right) for each peak. See
Figure 3-25 on page 3-70.
Valley-to-Valley
Forces a baseline through all valley points. See Figure 3-25
on page 3-70.
Trace Settings
Use same settings
for all traces in view
Applies settings to all traces in the active window.
Table 3-1 Chromatogram Settings (Continued)
Parameter
Description
Summary of Contents for Data Explorer 4 Series
Page 1: ...Data Explorer Software Version 4 Series Software User Guide ...
Page 10: ...Table of Contents x Applied Biosystems ...
Page 56: ...Chapter 1 Data Explorer Basics 1 42 Applied Biosystems 1 ...
Page 98: ...Chapter 2 Using Chromatogram and Spectrum Windows 2 42 Applied Biosystems 2 ...
Page 172: ...Chapter 3 Peak Detection and Labeling 3 74 Applied Biosystems 3 ...
Page 204: ...Chapter 4 Examining Chromatogram Data 4 32 Applied Biosystems 4 ...
Page 270: ...Chapter 5 Examining Spectrum Data 5 66 Applied Biosystems 5 ...
Page 316: ...Chapter 6 Using Tools and Applications 6 46 Applied Biosystems 6 ...
Page 384: ...Chapter 9 Troubleshooting 9 22 Applied Biosystems 9 ...
Page 388: ...Appendix A Warranty A 4 Applied Biosystems A ...
Page 416: ...Appendix C Data Explorer Toolbox Visual Basic Macros C 20 Applied Biosystems C ...


