


Using the Ladder Sequencing Toolbox
Data Explorer
™
Software User’s Guide
C-7
C
7.
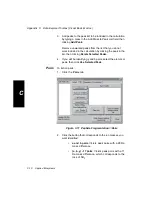
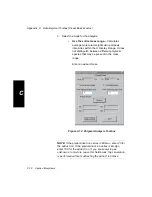
Under Annotate Spectrum, select the types of labels you
want displayed:
•
Reference Mass (*)
Mass of the reference
peak against which the current peak is
compared.
•
Mass Difference
Difference between the
current peak and the reference, preceded by a
minus sign (–).
•
Peak Mass
Mass of the current peak,
preceded by an equal sign (=).
8.
Click Label Peaks.
If Peptide is selected, the software:
•
Examines the spectrum in 55 Da increments
and selects the most intense ion in the range.
(The 55 Da increment is used because it is
less than the smallest mass difference related
to a residue.)
•
Labels mass differences (plus or minus the
specified Tolerance) that correspond to amino
acids.
•
Labels the reference peak from which the
mass difference was derived with an
asterisk (*).
•
Applies the additional labels you selected
under Annotate Spectrum.
Summary of Contents for Data Explorer 4 Series
Page 1: ...Data Explorer Software Version 4 Series Software User Guide ...
Page 10: ...Table of Contents x Applied Biosystems ...
Page 56: ...Chapter 1 Data Explorer Basics 1 42 Applied Biosystems 1 ...
Page 98: ...Chapter 2 Using Chromatogram and Spectrum Windows 2 42 Applied Biosystems 2 ...
Page 172: ...Chapter 3 Peak Detection and Labeling 3 74 Applied Biosystems 3 ...
Page 204: ...Chapter 4 Examining Chromatogram Data 4 32 Applied Biosystems 4 ...
Page 270: ...Chapter 5 Examining Spectrum Data 5 66 Applied Biosystems 5 ...
Page 316: ...Chapter 6 Using Tools and Applications 6 46 Applied Biosystems 6 ...
Page 384: ...Chapter 9 Troubleshooting 9 22 Applied Biosystems 9 ...
Page 388: ...Appendix A Warranty A 4 Applied Biosystems A ...
Page 416: ...Appendix C Data Explorer Toolbox Visual Basic Macros C 20 Applied Biosystems C ...


