background image

Saving and Recalling Measurement Logs

Measurement Logs are saved as CSV (comma-separated values) files.
Follow the steps below to view results in a measurement log file.

1

Copy the measurement log file from the Serial BERT to your PC. By
default, log files are saved in the folder 

C:\N4903A\log

.

2

Open a spreadsheet application on your PC.

3

Import the measurement log file. If your application has an import
wizard, you may need to indicate that data is delimited with commas.

4

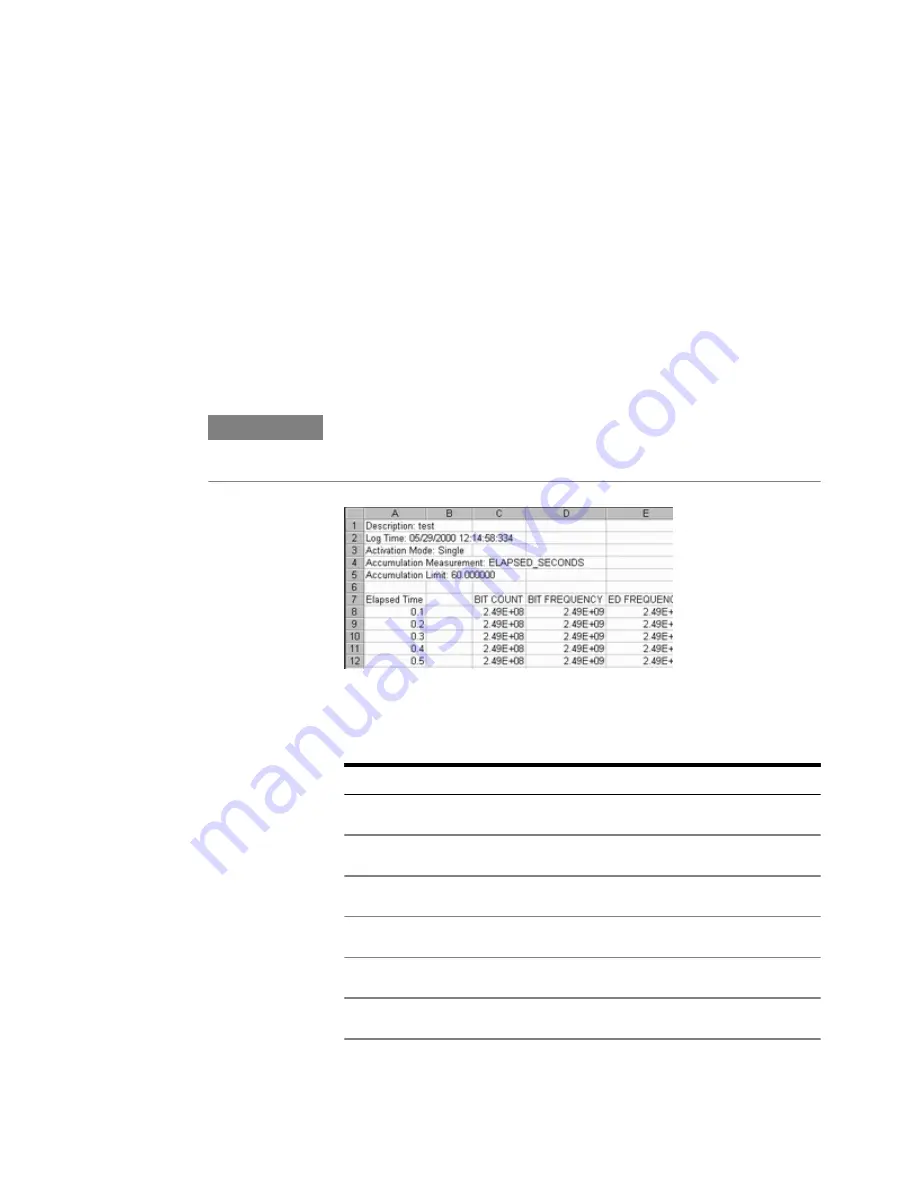
Once the file has been imported, you may need to resize columns.
The imported log file should appear similar to the following example.

N O T E

During measurement logging, the Serial BERT logs data in ten-second intervals.
Your log file may be missing up to the last ten seconds of data. To avoid this
condition, accumulate for 10 seconds longer than desired.

You can view and analyze the following information in the measurement
log file:

Table 29

Instantaneous

Cumulative

BIT COUNT

BIT COUNT Cumulative

ERROR COUNT

ERROR COUNT Cumulative

ERROR RATIO

ERROR RATIO Cumulative

ERRORED 0 COUNT

ERRORED 0 COUNT Cumulative

ERRORED 0 RATIO

ERRORED 0 RATIO Cumulative

ERRORED 1 COUNT

ERRORED 1 COUNT Cumulative

Customizing the Instrument

9

Agilent J-BERT N4903 High-Performance Serial BERT

423

Summary of Contents for J-BERT N4903

Page 1: ...S Agilent J BERT N4903 High Performance Serial BERT User Guide s Agilent Technologies...

Page 2: ...dware and or software described in this document are furnished under a license and may be used or copied only in accordance with the terms of such license Restricted Rights Legend If software is for u...

Page 3: ...es 38 User Patterns Reference 43 Software Generated PRBS 51 Software Generated PRBS Concepts 51 Software Generated PRBS Procedures 53 Software Generated PRBS Reference 53 Hardware Generated PRBS 54 Ha...

Page 4: ...Concepts 99 Error Addition Insertion Procedures 99 Error Addition Insertion Reference 101 Pattern Alternation 102 Pattern Alternation Concepts 102 Pattern Alternation Procedures 104 Pattern Alternati...

Page 5: ...n Procedures 155 BER Location Reference 155 Audio Signals 156 Audio Signals Concepts 156 Audio Signals Procedures 156 Audio Signals Reference 157 5 Advanced Analysis Advanced Analysis Concepts 159 Adv...

Page 6: ...lts Evaluating Results Concepts 297 Instantaneous Measurements 297 Instantaneous Measurements Concepts 297 Instantaneous Measurements Procedures 298 Instantaneous Measurements Reference 300 Accumulate...

Page 7: ...Problems Concepts 375 Measurement Problems 378 Measurement Problems Concepts 378 Other Messages 384 Other Messages Concepts 384 Problems with the N4916A 386 Problems with the N4916A Concepts 386 9 Cus...

Page 8: ...erver 414 Customizing the Web Server Concept 414 Printing 418 Printing Procedures 418 File Management 421 File Management Procedures 421 Preset Instrument State 425 Preset Instrument State Procedures...

Page 9: ...the types of testing you can do with the Serial BERT Connecting the DUT Concepts on page 17 tells you how you should connect your DUT to the Serial BERT Introduction to the Serial BERT Introduction to...

Page 10: ...the Operating System on page 396 Note also that there is a recovery image on the hard disk See the Windows Help for instructions on restoring a recovery image Understanding BER Bit error ratio BER is...

Page 11: ...RT comes with advanced jitter generation capabilities for jitter tolerance testing J BERT The instrument provides Excellent waveform performance Outstanding rise times and jitter performance A choice...

Page 12: ...l and bounded uncorrelated sources J11 Spread Spectrum Clock SSC generation J12 Option Upgrade for Jitter Tolerance Compliance tests Use this test to ensure that the jitter tolerance of the device und...

Page 13: ...system The analyzer will compare the bits sent to your device with the bits received from your device It will record the number of bit errors and display results such as the bit error ratio BER In ad...

Page 14: ...uirements of Your Device Considering the requirements of your device will help you choose which instrument functions to use during the test setup and when making measurements Do you need to use a cust...

Page 15: ...formation Does your device require differential inputs As complementary outputs Data Clock Out and Data Clock Out may satisfy this requirement See Diagram 2 Connections for Differential Inputs on page...

Page 16: ...seconds 48 seconds 3 2 minutes The formula for confidence level is as follows C 1 e nb Where C degree of confidence 0 95 95 e natural base number n number of bits examined without error b desired res...

Page 17: ...hey are not connected The following procedure is recommended when setting up a test 1 If your DUT can handle 0V press the 0V Disable button in the PG Output Setup screen The pattern generator s Data O...

Page 18: ...oper use of a grounded resistor isolated wrist strap Connect your device according to the diagrams below Diagram 1 Connections for Different In Out Data Rates Often used for multiplexers or when the d...

Page 19: ...iagram 3 Connections for an Amplifier Often used for amplifiers Diagram 4 Connections for a Flip Flop Often used for flip flops Planning the Test 1 Agilent J BERT N4903 High Performance Serial BERT 19...

Page 20: ...data signals between the MUX DEMUX pair must be set properly Diagram 6 Connections for a DCA or Oscilloscope PGonly Used for measuring the output waveform of your device For the least amount of jitte...

Page 21: ...e Illustrates the use of an oscilloscope in addition to the error detector N O T E As in all setups the pattern sent to the error detector must be the same as the internal reference pattern of the err...

Page 22: ...of the N4916A The unused output of the Pattern Generator has to be terminated with 50 Ohm The N4916A provides a differential signal to the DUT The N4916A is controlled by the Serial BERT via a USB cab...

Page 23: ...into the memory and generating the output according to the pattern in the memory These memory based patterns can be either user patterns file based or software generated patterns The hardware generate...

Page 24: ...there are two main branches corresponding to the hardware generated and memory based patterns and the memory based patterns are further broken down into software generated patterns and user patterns...

Page 25: ...sting of devices because large patterns contain long strings of 0 s and 1 s Software generated PRBSs are non inverted PRBS 2 n patterns They are also called PRBN patterns These patterns are useful for...

Page 26: ...ns For pattern dependency testing choose one of the Example Patterns on page 33 or use a custom user pattern vary the mark density For eye diagram measurements and mask analysis use the Serial BERT wi...

Page 27: ...rial BERT reads the memory bit by bit and generates the output accordingly The following topics explain how the Serial BERT works with user patterns and also explain how user patterns are generated N...

Page 28: ...must be composed of at least 7 lines The first 6 lines start with a keyword to identify the field followed by an sign There should be no spaces around the sign and no blank lines Use the following ke...

Page 29: ...rmat each character represents four bits only the characters 0 to 9 and A to F are allowed not case sensitive In binary format each character represents eight bits all ASCII characters are allowed Exa...

Page 30: ...a user pattern that is 256 001bit bit long would have to be loaded into the RAM 512 times to reach the 512 bit boundary Such a pattern would occupy more than 128 Mbits in the RAM The Serial BERT handl...

Page 31: ...generator and error detector are not automatically updated For this you need to write the pattern to the pattern generator and or the error detector There the pattern is saved in the RAM of the respe...

Page 32: ...replica of pattern A except for the addition of one error and the pattern is an odd number of bits long the error will be repeated 512 times when B is sent because pattern B is sent 512 times before s...

Page 33: ...continuously during the test by repeating the pattern The sequence causes a near worst case condition for inter symbol interference and duty cycle base line wander FDDI_Wander ptrn The FDDI baseline w...

Page 34: ...ter RJ and the symmetry of logic transitions The pattern is composed of alternating logic highs and lows and is repeated continuously Disparity rules are followed 1010101010 1010101010 binary CSPAT pt...

Page 35: ...DH_STM 16_CID ptrn Pattern is a SDH STM 16 rate Consecutive Identical Digit CID pattern same length as a SDH frame with nine bytes of all 1s and nine bytes of all 0s separated by random data This impl...

Page 36: ...e Defect Indication RDI alarm SDH_STM 16_OOF ptrn Pattern for testing Out of Frame OOF alarm SDH_STM 16_RS BIP ptrn Pattern for testing frames with erred parity check sums B1 error All patterns are al...

Page 37: ...all 1s then the normal scrambler sequence 2 7 PRBS starting with 1111 111 Half way through the frame at row 5 column 40 an A1 A2 and C1 sequence is inserted again followed by a block of bytes set to a...

Page 38: ...alt ptrn Pattern for testing frames with erred parity check sums B2 error SONET_STS 48_L FERF_alt ptrn Pattern for testing L FERF alarm SONET_STS 48_OOF_alt ptrn Pattern for testing Out of Frame OOF a...

Page 39: ...og box where you can Enter a Description for the pattern Specify the pattern s Length in Bits Specify the pattern s Pattern Type Standard or Alternate 3 After you have entered these parameters click O...

Page 40: ...ns on page 39 3 To change the pattern length or description or to switch between standard and alternating patterns press the Properties button The Pattern Properties dialog box appears 4 Define the pa...

Page 41: ...ialog box 1 Press the Pattern Select icon in the Pattern menu The Pattern Select Form dialog box opens 2 Select one of the following pattern types for the pattern generator and follow the next require...

Page 42: ...g a pattern in the pattern editor you can load this pattern directly to the pattern generator and error detector N O T E Keep in mind that your modifications in the Pattern Editor do not affect the pa...

Page 43: ...sing SaveAs option The user will be prompted to save the captured pattern if a new pattern is loaded and the same pattern is recaptured User Patterns Reference The elements of the pattern editor and a...

Page 44: ...and path for the file To PG Click this icon to send the pattern from the editor to the pattern generator To ED Click this icon to send the pattern from the editor to the error detector To Pattern Cap...

Page 45: ...With Overwrite mode you overwrite the bits at the cursor position Hex Bin Click this icon to toggle between viewing the pattern in hex or binary mode Properties Click this icon to change the propertie...

Page 46: ...no function Pat Sel Click this icon to open the Pattern Select Form dialog box For more information see Loading Patterns to the Pattern Generator and Error Detector on page 41 T I P If you are workin...

Page 47: ...ary position in the pattern Enter the bit position address and click Go The cursor is placed in front of the character with the selected bit You can continue editing the pattern while this dialog box...

Page 48: ...e captured Pattern Pattern capture length in bits Captures the entire pattern length of currently loaded pattern in the error detector Captures the maximum 32Mbit pattern length of currently loaded pa...

Page 49: ...ialog box you define the Range that is to be modified and an Action that will be done to this range The available options for the Range are Select All Choose this option to select the entire pattern f...

Page 50: ...generator See Sequence Mode Characteristics on page 58 for details You can choose between the following types of patterns User Pattern from File With this option you can load a pattern that is stored...

Page 51: ...n page Enables the error detector s bit recovery mode For details see Understanding Bit Recovery Mode on page 128 Software Generated PRBS Software Generated PRBS Concepts Software generated patterns a...

Page 52: ...Longest Run of 1 s Longest Run of 0 s 7 128 7 7 10 1 024 10 10 11 2 048 11 11 13 8 192 13 13 15 32 768 15 15 23 8 388 608 23 23 Zero Substitution Patterns A potential risk to bit errors are longer row...

Page 53: ...e in a randomly distributed way This may be useful for systems that are AC coupled This helps to check for effects such as baseline wander To test these cases the Serial BERT provides PRBS patterns wi...

Page 54: ...spectral contents of PRBS 2 n 1 patterns and the special property of decimation may also be useful in many applications for example for multiplexer or demultiplexer testing How the Hardware Generates...

Page 55: ...before the pattern is finally inverted Table 10 n Sequence Length Longest Run of 1 s Longest Run of 0 s 7 127 7 6 10 1 023 10 9 11 2 047 11 10 15 32 767 15 14 23 8 388 607 23 22 31 2 147 483 647 31 30...

Page 56: ...scribes the basics of user defined sequences A sequence is created and maintained by means of the Sequence Editor that can be enabled from the Pattern window A sequence consists of up to four blocks E...

Page 57: ...numbered Loop repeated for every loop not numbered Example of a SequenceExpression Version 1 0 Start IMM Block 1 PRBS11 1024 TrigOn Block 2 C N4903A Pattern Upat10 ptrn Block 3 P0 512 TrigOff Loop B1...

Page 58: ...ine the transition from the end of a block to the beginning of the same or a previous block It is not possible to jump into an existing loop It is also not possible to specify loops within loops exept...

Page 59: ...attern Generator Pattern is automatically disabled You have to download the expected payload pattern to the error detector During initialization of the sequence pure zeros are sent User Defined Sequen...

Page 60: ...ition box labeled INF appears Click the in arrow of the same or a previous block This closes the loop Click the condition box and choose the appropriate break condition 6 Download the sequence to the...

Page 61: ...escribed below Sequence Block Display A new sequence consists of one block that is infinitely repeated looped By default this block has a length of 512 bits and generates a Pause0 signal a continuous...

Page 62: ...Trigger Out port has been set to Sequence Trigger mode and TrigOn is set for each block as shown by the vertical trigger indicator Edit Button of a Block To change the contents of a block click its E...

Page 63: ...depends on the loop end condition If the loop end condition is INFinite or determined by the Aux In port then the pattern is automatically repeated until 512 bits or a multiple thereof is reached In t...

Page 64: ...n by Aux In High Aux In Low The loop ends when Auxiliary Input is high or low Sequence execution continues with the next block Aux In Rising Aux In Falling The loop ends when a rising or falling edge...

Page 65: ...Click this icon to save the current sequence in a new file A Save As dialog box opens for you to specify name and path for the file See Saving the Sequence in a File on page 60 for details To PG Click...

Page 66: ...quence If the sequence start condition is IMMediate the sequence restarts immediately If the sequence start condition is a signal at the Aux In port the sequence restarts upon the specified signal If...

Page 67: ...How a Sequence is Defined on page 57 You can edit the SequenceExpression in this field Any changes override the previous settings N O T E If you edit the SequenceExpression manually take care to adher...

Page 68: ...2 Setting up Patterns 68 Agilent J BERT N4903 High Performance Serial BERT...

Page 69: ...enerator to add jitter to the generated signal Adding errors to the output stream The Serial BERT can be set up to insert errors into the outgoing stream either internally according to an external sig...

Page 70: ...rror detector and an arbitrary data signal for testing your device The pattern generator has the following inputs and outputs Understanding the Pattern Generator s Input Ports The pattern generator pr...

Page 71: ...ock Out and Clock Out The clock outputs serve as frequency bit rate references and can be set up so that they are compatible with a variety of logic families With respect to Clock Out Clock Out has in...

Page 72: ...ins unchanged As soon as a 50 load and the correct external termination voltage is detected again the algorithm automatically switches back to the user adjusted output levels These changes are neither...

Page 73: ...n Vampt is changed On the other hand you may want to adjust the output voltage level without changing the amplitude The Serial BERT handles this by keeping Vampt constant when either Vof Vhi or Vlo is...

Page 74: ...80 and 20 Understanding how the Serial BERT Uses Logic Families and Terminations The clock and data inputs of your device have load impedances or terminations Clock and data terminations refer to the...

Page 75: ...ould Damage Your Device on page 76 The following table lists the characteristics generally associated with some logic families All values are nominal Table 14 Logic Family Vhigh V Vlow V Ampl mV Term...

Page 76: ...ed AC Coupling and Bias Tees The pattern generator s outputs are normally DC coupled even when AC termination is selected For this reason extreme caution must be taken when connecting your instrument...

Page 77: ...l signal De emphasized signals are used to adapt the signal waveform to the characteristics of real transmission lines as found on printed circuit boards They can considerably reduce the impact of Int...

Page 78: ...erates the specified and indicated voltages as usual The bit rate setting of the Serial BERT is automatically transmitted to the N4916A Other functions of the pattern generator for example adding jitt...

Page 79: ...ery careful if you set the de emphasis ratio to amplification In this case there is no indication of the peak to peak voltage applied to the DUT You need to calculate or measure the output signal volt...

Page 80: ...tput ports of the pattern generator that are not connected to another device must be terminated with 50 Ohm to prevent the Serial BERT from damage Note that for unconnected ports an internal protectio...

Page 81: ...termination as described in or enter custom levels as described in Adjust Output Levels optional on page 80 3 Press De Emphasis to open the De Emphasis Connection dialog window 4 Press Connect to act...

Page 82: ...between the pattern generator and the N4916A N O T E It is possible to set the de emphasis ratio to a negative dB value an amplification This allows you to generate a pre cursor de emphasis C A U T I...

Page 83: ...voltage level halfway between logic high and logic low the offset and displays the current value To modify the value click inside the text field and either Enter the desired value directly with the nu...

Page 84: ...de the text field and either Enter the desired value directly with the numeric keyboard Use the knob by the numeric keyboard to fine tune the value T I P You can also adjust delay with the Data Out De...

Page 85: ...ly It is recommended that you keep the default values of the terminations See Understanding how the Serial BERT Uses Logic Families and Terminations on page 74 for additional information 0V Disable C...

Page 86: ...ignal for example start sequence execution or break loop is defined in the SequenceExpression For details see User Defined Sequences Concepts on page 56 De Emphasis Press the De Emphasis button to con...

Page 87: ...the pattern generator It can be generated internally or supplied from an external source When to Use an External Clock Source The Serial BERT s internal clock can be used for most testing purposes The...

Page 88: ...n generator can only be operated with an external clock source because the internal clock source can only produce signals higher than 620 Mbit s The trigger output cannot be set up to trigger on certa...

Page 89: ...nominal clock frequency With SSC the clock pulse is modulated with a relatively low frequency triangle waveform This broadens the clock signal spectrum and reduces the peak energy The Serial BERT has...

Page 90: ...f the external source is automatically measured and used If the source frequency varies the generated clock varies as well In manual mode you can measure and set the rate of the external clock source...

Page 91: ...ternal PLL The pattern generator uses the external clock that must be connected to the Clock Input This clock is routed internally through a PLL You can choose between Automatic and Manual Mode on pag...

Page 92: ...og box you can enter a value unit and text description of the new clock rate Delete Preset Button Select a preset clock rate in the Preset list and click this button to remove it from the list You can...

Page 93: ...The pattern generator s Trigger Out port can be used to send a reference signal or trigger to external devices like an oscilloscope or digital communication analyzer In pattern mode the pattern gener...

Page 94: ...for details Trigger Output Reference You can always generate a divided clock signal at the Trigger Out port But if you wish to use the Trigger Out port for controlling external equipment please note...

Page 95: ...ns with a length divisible by 512 there is one trigger pulse sent for every pattern repetition Data Out Trigger Out A B A B B If the length of the pattern is not divisible by 512 a trigger is sent whe...

Page 96: ...tern Length 1 For pattern lengths that are divisible by 512 such as 2 n PRBS patterns the trigger repetition rate is one pulse per pattern repetition Data Out Trigger Out Bit Pos A A A For pattern len...

Page 97: ...e used to delay the data relative to the clock The delay is controlled by an external signal connected to the Delay Ctrl In connector on the pattern generator front panel The delay control input is in...

Page 98: ...ures N O T E The following procedure does not apply to an Serial BERT on which the calibrated and integrated jitter injection option J10 is installed For such instruments refer to Jitter Setup Procedu...

Page 99: ...n the data pattern you can insert logic errors flipped bits into the pattern The instrument provides several options in the pattern generator s Error Add dialog box for inserting error bits manually o...

Page 100: ...an error will be generated in the output stream by flipping a single bit within a bit block of 128 bits resulting in a maximum BER of 1 128 or 10 2 T I P You can use an external signal to set up a bi...

Page 101: ...e found by the error detector N O T E If you set up too high an error rate the error detector will not be able to synchronize to the incoming pattern When setting up an error rate always make sure tha...

Page 102: ...1 000E 02 to 1 000E 09 Errors will be added to the output pattern to produce this error ratio Bits Between Errors Allows you to enter the number of valid bits between two errors This is the inverse o...

Page 103: ...p Patterns Concepts on page 23 for more details Alternating patterns consist of two patterns one of which is pattern A the A half the other is pattern B the B half Both patterns are of equal length ea...

Page 104: ...A is output repeatedly Continuous B Only pattern B is output repeatedly Alternate AB The output stream switches between pattern A and pattern B Single Shot B With this option selected the Insert B bu...

Page 105: ...in Level Sensitiveor Edge Sensitive mode See Aux In on page 107 for more information on the different available modes 4 Click OK to close the dialog box Suppressing the Outputs via External Signal You...

Page 106: ...nuous B Select this option to send out only pattern B repeatedly B0 B1 B2 B B B B B B B B B B B B Data Out Alternate AB Select this option to alternately send out patterns A and B A B A B Data Out B0...

Page 107: ...ed Level Sensitive If Aux In is logic high pattern B is sent If Aux In is logic low pattern A is sent Aux In Data Out A A B A B B B Edge Sensitive Pattern A is sent out until a rising edge at Aux In i...

Page 108: ...havior the patterns may be repeated up to 512 times before alternating See How the Serial BERT Generates Memory Based Patterns on page 31 for details 3 Setting up the Pattern Generator 108 Agilent J B...

Page 109: ...am Appropriate sampling point The sampling point defines where the error detector tries to differentiate between 0s and 1s in the data stream This is necessary so that the error detector recognizes th...

Page 110: ...ut for external measurement instruments This allows you to connect other devices for further error analysis N O T E When the Bit Recovery Mode BRM option is installed the error detector is able to det...

Page 111: ...de it can be used to enable and disable the error counter Errors are only counted when this signal is low The error counter can only count errors in 128 bit data blocks Thus the signal at the Gate In...

Page 112: ...rnal instrument to help in error analysis When any number of errors are located within a 128 bit data block a single trigger pulse is sent If continuous errors are detected the error out signal would...

Page 113: ...voltage in the respective field C A U T I O N Selecting the wrong termination may damage your device Why Can Wrong Terminations Damage Your Device Choosing wrong terminations may cause your device to...

Page 114: ...e front panel knob or the numeric keypad to enter the value C A U T I O N Selecting the wrong termination may damage your device 4 Select the Data Inverted checkbox if your device inverts data You can...

Page 115: ...t Enter a value for applications that do not provide a continuous data stream at the input for example any application using bursts because the averaged 0 1 threshold voltage will drift from the corre...

Page 116: ...indow Clock Setup Clock Setup Concepts To measure the Bit Error Rate with the error detector the bit rate of the data stream must be known Depending on the options the instrument is delivered with you...

Page 117: ...inputs The loop filter is a low pass filter which attenuates the higher frequencies from the output of the phase detector The VCO is an adjustable oscillator which changes the output frequency dependi...

Page 118: ...Additionally the Peaking can be chosen from a drop down list Transition density affects the loop parameters and it must be either entered or measured Some standards define a loop bandwidth for a speci...

Page 119: ...that lies between the high and low levels of the incoming signal The differential threshold of the data path comparator has no relation to the single ended threshold of the CDR path comparator This me...

Page 120: ...ative to the clock signal For frequencies above 620 Mbit s this range is sufficient to cover the complete clock cycle 1 unit interval For lower frequencies the maximum sampling point delay is smaller...

Page 121: ...sult you might not be able to find the optimum sampling point if it falls in one of the gaps Clock Setup Procedures To set the clock rate 1 Press Clock Setup in the ED Setup menu 2 Specify whether you...

Page 122: ...Clock Setup Reference The Clock Setup window contains the following elements Error Detector Bit Rate The bit rate of the data reaching the error detector is displayed in the lower right corner of the...

Page 123: ...range and it is not necessary to select the range The number of ranges and the whole frequency range depend on the instrument and its options The available range is displayed here Preset List The Pre...

Page 124: ...th In this field the user should enter the loop bandwidth value the range is within 100 KHz to 12MHz If a standard from the preset list is selected this field is preset When the BERT error detector is...

Page 125: ...is recommended for all applications where a valid data stream is continuously arriving at the error detector For measurements with partly invalid data such as burst tests this function may cause a clo...

Page 126: ...agrams How Does the Sampling Point Setup Work The sampling point of a data signal is defined by two values a point in time and a voltage level Each bit of the data signal is sampled at this point in t...

Page 127: ...tector must be set within the data eye The error detector uses the eye diagram to graphically display the location of the sampling point Additionally the appearance of the eye is useful for determinin...

Page 128: ...ng point and investigate the behavior of the DUT in detail The error detector compares the bits at your sampling point with the bits recognized at the hidden sampling point As you move the visible sam...

Page 129: ...make some manual adjustments it is recommended to start with automatically aligning the sampling point N O T E Before adjusting the sampling point make sure the pattern synchronization mode is set up...

Page 130: ...the 0 1 Decision Threshold 1 Press the Sampling Point Setup icon in the ED Setup menu 2 Clear the Avg 0 1 Threshold checkbox 3 Click 0 1 Threshold Center to move the sampling point vertically towards...

Page 131: ...some of the following functions may not be valid for your instrument See Introduction to the Serial BERT Concepts on page 9 and Which Features are Available on page 11 for a description of the availa...

Page 132: ...ust the data input delay in the following ways Click inside the text field and use the numeric keypad or front panel knob to enter a value Click anywhere in the sampling point display The sampling poi...

Page 133: ...ion can be used for determining the optimum 0 1 threshold for asymmetric data eyes or for patterns with an unequal mark density The status message bar will indicate if this function is unsuccessful Th...

Page 134: ...alues returned to previous Status of Data Inverted and Avg 0 1 Threshold checkboxes returned to previous 0 1 Threshold Center Canceled 0 1 Threshold value returned to previous Status of Avg 0 1 Thresh...

Page 135: ...mmended to use this prior to clock data alignments When used with the following patterns this function may provide a 0 1 threshold that requires no further adjustment 2 n 1 PRBS patterns Patterns with...

Page 136: ...revious state Trigger and Aux Output Trigger and Aux Output Concepts The error detector has a Trigger Out and an Aux Out port that you can use to send signals to other external devices such as an osci...

Page 137: ...is selected the input data is output over a comparator at Aux Out The comparator is controlled by the 0 1 threshold This lets you use an oscilloscope to determine if the 0 1 threshold is correctly set...

Page 138: ...or above the data eye the output at Aux Out will be constant high or low respectively Pattern Synchronization Pattern Synchronization Concepts The Serial BERT calculates bit error rates by comparing t...

Page 139: ...bits with the pattern If the measured BER is better than the synchronization BER the error detector is synchronized There are thus three possible outcomes for a synchronization Single instance of the...

Page 140: ...Pattern Detect Word 48 bits Detect Word 48 bits Incoming Bit stream Detect Word 48 bits Detect Word 48 bits Detect Word 48 bits Reference Point False Sync If the error detector attempts to synchroniz...

Page 141: ...ansparent requiring no attention However for special applications changes can be made to the sync mode and sync threshold What Type of Synchronization Should You Use The type of synchronization you us...

Page 142: ...on For patterns other than PRBS the error detector may gain sync at a point in the pattern that meets the sync threshold but is not the correct point where the internal reference pattern and the recei...

Page 143: ...ing a pattern other than PRBS and the error detector gains sync but auto search functions Auto Align Clock Data Center 0 1 Threshold Center repeatedly fail In a false sync the sync threshold BER of 1E...

Page 144: ...e same value as the sync threshold BER Introduction to Burst Sync Mode The burst sync mode is a special operating mode for measuring data in bursts of bits rather than one continuous stream of bits Th...

Page 145: ...g Time Synchronization Time no BER OK success failed Total Burst 1 Bad Burst 1 Incr Bit Counters yes no Register Incoming Bits Gate In no yes 1 2 3 4 5 6 7 N O T E Burst mode requires a complete measu...

Page 146: ...tion the total burst counter and bad burst counter are incremented The bit counters total count error count etc are not incremented 6 At the end of the burst the data is analyzed the bits are counted...

Page 147: ...chronization Time is the time the error detector requires to synchronize to the pattern This time depends on the pattern type PRBS or memory based The Valid after Gate indicates the minimum length of...

Page 148: ...he following values can be derived from these parameters Table 16 Parameter Values Begin Margin CDR Settling Time Synchronization Time End Margin Valid after Gate Bit Count Time BurstLength BeginMargi...

Page 149: ...st thus increasing the bad burst count You can typically reduce the bad burst count by starting the gating period later Burst Attempted Settling Time ends here Start too soon CDR Settling Time Synchro...

Page 150: ...ming pattern to the expected pattern 1 Press Pattern Sync in the ED Setup menu 2 Select the synchronization mode Normal or Burst sync mode 3 If you selected Normal synchronization mode choose whether...

Page 151: ...etector synchronizes to the incoming pattern The signal at the Gate In port controls the timing of synchronization and error counting for each burst The SyncThreshold defines when the error detector a...

Page 152: ...ry displayed at the bottom of the dialog box Use the Browse button to select a different directory 6 Click OK to apply your selections and close the Accumulation Setup dialog box For more information...

Page 153: ...ll overwrite the measurement log file with each new test run However in Repeat mode the results of all repetitions will be appended to this file and no information is lost No Logging Click this option...

Page 154: ...hile accumulation is progress Browse Click this button to browse for the directory where you wish to save the measurement log files N O T E Changes to the parameters of the accumulation setup do not t...

Page 155: ...the BER location mode setup BER Location Reference The Bit Error Location Mode dialog box offers the following options With this option all errors are counted With this option only errors occuring in...

Page 156: ...e audio signals on and off you can also use the Audio On Off front panel button 3 Use the Main Volume slider to adjust the volume After adjusting the slider a test tone is played at the new volume 4 C...

Page 157: ...option to make the analyzer play warning tones when a specific BER is exceeded The BER Alarm Threshold is the threshold at which tones are produced Enter the BER threshold in the following format numb...

Page 158: ...4 Setting up the Error Detector 158 Agilent J BERT N4903 High Performance Serial BERT...

Page 159: ...allows you to characterize the behavior of the output levels of a device under test DUT The sampling delay is fixed The error detector s decision threshold is automatically swept within a user defined...

Page 160: ...igating the behavior of the DUT for example to identify crosstalk effects Before you can run any of these advanced measurements you have to properly set the required parameters After the test is compl...

Page 161: ...his includes the settings you selected for the measurement and the measured data This allows you to load the measurement at a later stage and inspect all data in detail You can also change display par...

Page 162: ...tOptions button to open the Export LogfileFormat dialog box 4 Make further selections for the format of the exported data Press OK to close the dialog box 5 Press OK to export the data to the specifie...

Page 163: ...ied measurement for easy distinction 1 Highlight the copied measurement 2 Press Enter or choose Rename from the context menu 3 Change the name and press Enter How to Load Measurements To load previous...

Page 164: ...itions that must be met by the DUT to pass a test Changes here do not require a new test run The data will be newly calculated and the results will be displayed View tab Graph tab and Color tab With t...

Page 165: ...ght yellow GridColor The color of the dashed grid lines default is gray PowerMarkerColor The color of the Noise Threshold marker default is red 2 Select the color that you want to change from the list...

Page 166: ...ype TM Fast Eye Mask SB Electrical UI 9 6969E 011 Threshold Units Volts Delay Relative 1 1 SerialBERT Delay Threshold BER All 3 878757E 011 1 504954E 001 2 497699E 001 3 878757E 011 1 504954E 001 2 49...

Page 167: ...e different units is listed below Table 17 Timebase Earliest Sampling Optimum Sampling Point Latest Sampling Time rel 1 5 ns 0 ns 1 5 ns abs 54 2 ns 55 7 ns 57 2 ns Unit interval rel 0 75 UI 0 UI 0 75...

Page 168: ...nts All time related entries understand both time and unit interval notation regardless of the UI time selection made in the View tab of the Properties dialog box You can enter 17s 5ns or 0 01UI at an...

Page 169: ...ce between the two vertical marker lines on the time axis X2 X1 and distance of the two horizontal marker lines on the BER axis BER1 BER2 The markers can be moved to keep track of the data A Gaussian...

Page 170: ...e parameter is the mean the parameter is the standard deviation The Gaussian marker shows such a curve Position height and width of this curve can be changed by dragging the handles and the actual par...

Page 171: ...ter graph is displayed It is most useful if deterministic jitter is present In this case the jitter graph shows more than one peak see also Estimated Total Jitter on page 177 The jitter values Mean RM...

Page 172: ...case it appears as a parabolic curve A Gaussian marker is used when the dBER vs Threshold Graph is displayed This graph shows the relationship between the decision threshold and the absolute values of...

Page 173: ...te BER measurement to evaluate the shape of the eye for the output signal of the DUT It also analyzes the jitter separates the random jitter and deterministic jitter components and estimates the total...

Page 174: ...ically Jitter Measurement Parameters on page 192 describes how these components are calculated A dedicated Gaussian marker allows to investigate the jitter graph in detail and to measure the contribut...

Page 175: ...measurement results see Explanation of the Fast Total Jitter Measurement Results on page 194 Understanding the Jitter Calculation After the output timing behavior of the DUT is measured the Serial BER...

Page 176: ...e mean of the two sigmas DJ is calculated as the period minus the difference of the two means 5 The estimated TJ is calculated Linear regression is used to extrapolate the bathtub curve to lower BER v...

Page 177: ...based on the points detected between the BER Threshold and the Minimum BER for RJ DJ Separation to the Residual BER for RJ DJ Separation level The estimated TJ is the period minus the width of the mea...

Page 178: ...of seeing one or no error in 1012 bits is not higher than 37percent If one would compare 1013 bits for the same device the probability of seeing ten errors is even lower 12 but the probability of obse...

Page 179: ...plicable to BER measurements The equations were solved for a level of confidence of 95 The calculations have led to the following table Table 20 95 confidence level lower limits BER 10 12 95 confidenc...

Page 180: ...o the BER no matter how many bits we transmit Whether such a test fails or passes depends entirely on the application Once we are able to decide for a measured point whether its BER is above or below...

Page 181: ...ter measurement The duration of a Fast Total Jitter measurement depends on the BER threshold the bit rate the sample delay step size the contribution of random jitter the contribution of deterministic...

Page 182: ...enerator s Data Out port and the error detector s Data In port 3 Terminate all non connected pattern generator output ports with 50 4 Use a shielded cable to connect the pattern generator s Data Out p...

Page 183: ...n 2 Press the Start button to execute the measurement The measurement software runs the measurement and displays the results The following illustration shows the bathtub curve of the measured bit erro...

Page 184: ...anges to close the Properties dialog box DUT Output Timing Jitter Reference The DUT Output Timing Jitter measurement returns the results in a graphical and in a numerical form The following sections d...

Page 185: ...e yields more sampling points in a unit interval You can enter the resolution in UI or ps ns s The timebase of the display is set on the View tab If the resolution used for the measurement is not high...

Page 186: ...e Pass Fail tab of the Properties dialog box allows you to specify the criteria to decide whether the DUT passes or fails the test You can change pass fail criteria without rerunning a test The softwa...

Page 187: ...Margin Optimal Sample Delay Total Jitter Peak to Peak Fast Total Jitter Uncertainty Other pass fail limits may be enabled but are ignored In the tabular view each of the calculated values will be mar...

Page 188: ...can be viewed in either linear and logarithmic view The logarithmic view is shown above The DUT Output Timing Jitter measurement calculates the jitter histogram as the absolute of the derivative of t...

Page 189: ...ian marker is available in this view to help analyze the jitter components See The Gaussian Marker on page 169 for details Furthermore the following parameters can be set on the View tab of the Proper...

Page 190: ...separation Residual BER for Estimated Total Jitter BER level for which the estimated total jitter is calculated See Estimated Total Jitter on page 177 for details on how it is used You can select the...

Page 191: ...back to the default positions Several zoom factors are available When you show the zoom graph you can also allow the zoom graph to track the mouse or your finger if you are working directly on the Ser...

Page 192: ...alues are the left and right intersections of the bathtub curves with the BER threshold Obviously all values change if the BER threshold is modified The following illustration shows an example for a m...

Page 193: ...easured points into Q space and performing a linear regression it is calculated as the period minus the difference between the means of the two straight lines Estimated Total Jitter A forecast of the...

Page 194: ...onfidence in the results is too low Explanation of the Fast Total Jitter Measurement Results The Fast Total Jitter measurement provides both graphical and numerical results The example below shows a c...

Page 195: ...eshold and the next point with a BER less than the specified Total Jitter BER Threshold left slope and vice versa right slope Total Jitter BER Threshold The BER threshold specified for the measurement...

Page 196: ...the relationship between the analyzer decision threshold and the derivative of the bit error rate dBER dTh A Gaussian marker allows you investigate the peaks of this graph Q from BER versus Threshold...

Page 197: ...t the display of the results There is no need to repeat the measurement Variable Decision Threshold Method The method used by this measurement is commonly known as Variable Decision Threshold Method I...

Page 198: ...sing the 0V Disable button in the PG Output Setup screen 2 Use a shielded cable to connect the pattern generator s Data Out port and the error detector s Data In port 3 Terminate all non connected pat...

Page 199: ...lignment were successful None of the error indicators should show red The resulting BER should be zero How to Execute the Output Levels Measurement To run the Output Levels measurement 1 Switch to the...

Page 200: ...w to the high level A resolution of 10mV results in 100 measured points per Volt Note that we have disabled the Edge Resolution Optimization 4 Press OK to close the Properties dialog box 5 Press the S...

Page 201: ...ted in the graph with small squares The headline of the graph tells the number of data points included in the display 101 This corresponds to the chosen threshold resolution of 100 steps per Volt With...

Page 202: ...hanges 5 Press the Start button to repeat the measurement with the new parameters The measurement now takes more time than the previous but it is also much more precise When you move the BER Threshold...

Page 203: ...Output Levels Reference The Output Levels measurement returns the results in a graphical and in a numerical form The following sections provide explanations of the measured parameters and the display...

Page 204: ...is 1 mV Low Level This is the lower end of the measured voltage range High Level This is the upper end of the measured voltage range Edge Resolution Optimization Turns the resolution optimization on o...

Page 205: ...fy the criteria to decide whether the DUT passes or fails the test You can change pass fail criteria without rerunning a test The software only uses the criteria to rate the results of a measurement N...

Page 206: ...In the following figure you can see how errors are flagged 5 Advanced Analysis 206 Agilent J BERT N4903 High Performance Serial BERT...

Page 207: ...graph shows the relationship between the analyzer decision threshold and the absolute values of the derivative of the bit error rate dBER dTh It is recommended to view this graph with a linear scale b...

Page 208: ...oper settings activate the Show Measured Points function on the Graph tab and switch to the BER vs Threshold graph Move the upper BER threshold marker vertical line so that a sufficient number of meas...

Page 209: ...rical results such as SNR can be displayed linearly or logarithmically in dB To analyze the graphs at a particular point you can use the markers Optionally you can display all related values for the m...

Page 210: ...parameters are summarized in the following table Table 22 Parameter Name Pass Fail High Level min max Low Level min max Mean Level min max Amplitude min max Threshold Margin min For all parameters pas...

Page 211: ...hreshold setting The noise result parameters are summarized in the following table Table 23 Parameter Name Pass Fail High Level Std Dev Low Level Std Dev Peak Peak Noise max Signal Noise Ratio RMS min...

Page 212: ...ld Signal Noise Ratio RMS The RMS Signal to Noise Ratio is calculated as Signal Noise Ratio Peak Peak The peak to peak Signal to Noise Ratio is calculated as Note that the Peak Peak Noise depends on t...

Page 213: ...e defined as follows Q Factor The Q factor is calculated as where 1 0 is the mean level of the 1 and 0 rails respectively and 1 0 is the standard deviation of the noise distribution on the 1 and 0 rai...

Page 214: ...e minimum for calculating Q factor values is two points It is recommended to use more than 5 points Q High Level R 2 The R2 parameter is an indicator that shows how well the converted data points fit...

Page 215: ...Low Level R 2 See the definition of Q High Level R 2 Unavailable Values Under certain circumstances some numerical results are not available This is indicated by invalid or notapplicable in the numeri...

Page 216: ...time to measure The Q factor is calculated as where 1 0 is the mean level of the 1 and 0 rails respectively and 1 0 is the standard deviation of the noise distribution on the 1 and 0 rails The 1 0 an...

Page 217: ...hould fit to two straight lines although a couple of assumptions and approximations have been made To determine the gradient and offset of these lines a linear regression is performed This is illustra...

Page 218: ...the values of 1 0 and 1 0 Notes on the Q Results You can specify the range of data points used for these calculations by means of the Min BER for Q and BER Threshold parameters see also View Tab on p...

Page 219: ...are excellent greater than 0 95 The mean levels and standard deviations returned by the Q factor calculations differ from the measured values The QBER vs Threshold graph may look as shown below If yo...

Page 220: ...e sample delay and the sample threshold With this measurement the complete eye of the DUT output signal is measured The results comprise the voltage and timing of the eye opening and the optimum sampl...

Page 221: ...isualized in three different ways Contour Plot The contour plot shows discrete lines of equal bit error rate just like the contour lines on a map The color of a line indicates the respective BER value...

Page 222: ...ions between the lines of equal BER This is useful to get an immediate visual impression of the distribution of the BER in the eye diagram Equal BER at BER threshold This graph displays only one curve...

Page 223: ...his section shows how to set up and perform an Eye Opening measurement As an example we measure the eye diagram of a shielded cable This requires the following steps Preparing the measurement see How...

Page 224: ...ort 3 Terminate all non connected pattern generator output ports with 50 4 Switch to the Pattern panel and press Pattern Select Select an appropriate pattern for example a pure 2 15 1 PRBS for both th...

Page 225: ...ted The following illustration shows the eye diagram of the measured bit error rate and in the tabular view the calculated results for the Time Eye Opening the ThresholdEyeOpening the OptimalSampleDel...

Page 226: ...tabs only affect the way the data is displayed You do not need to run the measurement again See View Tab on page 232 Graph Tab on page 234 and How to Change the Colors of the Graph on page 164 for de...

Page 227: ...large variety of colors for the bit error ranges Yellow Blue To display a color gradient from color1 to color2 for the bit error ranges Green Blue Red Green Black White White Black How to Change the...

Page 228: ...as To do so Move the handles of a color with the mouse or your finger if you are working directly on the Serial BERT This is particularly useful if you have set the display to show the Pseudo Color Pl...

Page 229: ...is 1 million bits That means you can measure a bit error rate down to 10 6 one error per million A smaller number reduces the duration of the whole Eye Opening measurement A larger number increases t...

Page 230: ...ower than the lowest expected signal voltage High Level Specifies the upper limit of the measurement voltage range Enter the value in mV This value should be slightly higher than the highest expected...

Page 231: ...lues will be marked with an icon if it failed the test The following illustration shows an Eye Opening measurement that has failed the criteria for the eye opening voltage Advanced Analysis 5 Agilent...

Page 232: ...r of a line indicates the respective BER value This graph is useful to visualize in which areas the BER changes a homogeneous BER field will give you no lines at all This plot visualizes the BER by a...

Page 233: ...xpected but 1 received Errors if 1s Expected To display the errors if 1 is expected but 0 received You can calculate measurement parameters for 0 Errors To calculate the parameters for 0 errors BER Th...

Page 234: ...marker readout Pressing the ResetMarkers button will set the markers back to the default positions Several zoom factors are available When you show the zoom graph you can also allow the zoom graph to...

Page 235: ...of the BER threshold contour line in sample voltage direction eye height Note This value is different from the vertical extension of the BER threshold bounding box Optimal Sample Delay This is the sa...

Page 236: ...ing voltage and the position of the optimum sampling point These parameters are derived as illustrated in the figure below Error Location Capture Error Location Capture Concepts The Error Location Cap...

Page 237: ...f a typical Error Location Capture measurement Important Requirements In order to perform Error Location Capture measurements the following requirements have to be met in addition to the ones listed i...

Page 238: ...n errored bit in an alternating pattern 1 Disable the pattern generator outputs by pressing the 0V Disable button in the PG Output Setup screen 2 Use a shielded cable to connect the pattern generator...

Page 239: ...nd disable Aux In 5 Set up the error detector so that the Clock Setup is set to Clock Data Recovery to get the error detector s clock from the incoming data stream 6 Switch to the Analysis panel and t...

Page 240: ...s successfully finished the display is automatically switched to the current run The current state is displayed in the title bar of the pattern grid First Error Jumps to the first errored bit in the p...

Page 241: ...r the error count date and time The name of the pattern file is ELOC_RESULT_CURRENT ptrn for the current capture and ELOC_RESULT_PREVIOUS ptrn for the previous capture These patterns are saved under C...

Page 242: ...an be the optimum sampling point and a threshold voltage which is adaptive In practice six measurement points will often suffice to approximate the shape of the eye Six measurement points are preset b...

Page 243: ...ative time can also be specified in seconds The Voltage is the decision threshold voltage at this measurement point The voltages of the measurement points can be set as absolute voltages as offset vol...

Page 244: ...tern generator s Data Out port and the error detector s Data In port 5 Switch to the Pattern panel and press Pattern Select Select an appropriate pattern for example a pure 2 15 1 PRBS for both the pa...

Page 245: ...s measurement point The voltages of the measurement points can be set as absolute voltages as offset voltages or as percentages How to Optimize the View of the Results After you have run a measurement...

Page 246: ...Set the criteria for moving to the next sample point Number of Compared Bits After this number of compared bits the measurement stops for the current sample point and moves to the next one The default...

Page 247: ...ltages Offset You specify the thresholds for the measurement points relative to the threshold voltage of the actual sampling point Percentage You specify the thresholds for the measurement points as a...

Page 248: ...ill be completed even if the measurement fails one or more of the criteria The Fast Eye Mask measurement has only one pass fail condition The bit error rate If desired enable the BER Threshold and set...

Page 249: ...T provides quick design analysis with the Eye Diagram capability The Eye Diagram allows a quick check for the DUT s signal output and determines the signal quality Due to the higher sampling depth of...

Page 250: ...ber of measured bits The following graph shows how the Eye Diagram has been integrated on the J BERT N4903A High Performance Serial BERT Methods of Representations There are two methods of representin...

Page 251: ...is a curve connecting points where the BER has a same particular value The contour graph is plotted within the Eye Diagram and it helps to determine the Eye Opening at deep bit error rates such as 1e...

Page 252: ...trapolation see Estimated Total Jitter on page 177 The Minimum Number of Errors indicates the minimum number of hits required to plot the contour Eye Mask Measurement Masks are marked regions on the s...

Page 253: ...rise time the fall time the eye amplitude and so forth These measurements are called Automated Eye Parameter Measurement they display the Eye behavior and they depend on the parameters set in the Vie...

Page 254: ...l on page 265 How to Export Fetched Data on page 265 How to Prepare the Eye Diagram Measurement An example to prepare an Eye Diagram measurement 1 Click 0V Disable on the PG Output Setup screen to dis...

Page 255: ...oming data stream 8 Enable Output How to Initiate an Eye Diagram Measurement To run the eye diagram measurement 1 Click the Analysis tab on the left panel 2 Click the Eye Diagram icon 3 Click the Star...

Page 256: ...he different tabs in this dialog box to make the required settings Parameters tab The Parameter settings used for the measurement can be changed only when the measurement is not running and if the set...

Page 257: ...ions set the parameters to measure and choose units for the displayed results in the numerical table Refer to View on page 268 for the detailed options Advanced Analysis 5 Agilent J BERT N4903 High Pe...

Page 258: ...Graph tab The graph settings give the display parameters like timing units waveform contour grid and markers 5 Advanced Analysis 258 Agilent J BERT N4903 High Performance Serial BERT...

Page 259: ...Eye Measurementstab The Eye Measurements tab lists out all the measurements The user can select specific results Advanced Analysis 5 Agilent J BERT N4903 High Performance Serial BERT 259...

Page 260: ...1 Click on the Graph tab 2 Select Show Maker Lines 3 Apply Setting This enables the markers and a marker readout button appears on the top left corner You also have an option to Reset Markers to their...

Page 261: ...orner to see the detailed marker readout How to Run the Mask Measurement To run the Mask Measurement the Eye Diagram measurement must be running 1 Click on the Mask tab 2 Click Load button 3 Select a...

Page 262: ...Identifier The mask file identifier is the first line in a mask file If the identifier string is missing or incorrect the file will not be loaded and an error dialog box will be displayed MASK_FILE_N...

Page 263: ...region or polygon Example to Number of Vertices Number of vertices 4 X and Y Coordinates These are the floating point numbers that define the locations of the mask polygon vertices for each region and...

Page 264: ...The above example MTES INP MODE DIFF sets the mode of the mask file to differential The mask mode when defined should match the mode set in ED Input Setup Dialog In case it doesn t match an error mess...

Page 265: ...Measurement 1 Click on the Analysis Menu 2 Click on Save Measurement To Recall the measurements 1 Click on the Analysis Menu 2 Click on Load Measurement How to Export Fetched Data You can export vario...

Page 266: ...creen appears The Clipboard option saves the data on a clipboard The Format Options takes you to the following screen You can select the Format Save to File and Error Options as per requirements 5 Adv...

Page 267: ...te the results While the measurement is running the parameter settings cannot be changed Set the criteria for Persistence Infinite With Infinite the eye appears with the Automated Eye Parameter Measur...

Page 268: ...s 2 0 eyes on the graph The transitions of the complete eye are placed such that they show 0 5 eyes on both sides So the total number of displayed eyes is 2 0 View Set the criteria for calculating the...

Page 269: ...e width custom This parameter gives the eye width at a specific percent of the eye amplitude Starting from low level to high level Eye height This parameter gives the eye height at a specific percent...

Page 270: ...sed to measure eye width in absolute terms of time Set the criteria for the waveform Show Waveform This option shows the waveform graphic Smooth Waveform Graphic The smooth waveform gives a finer wave...

Page 271: ...e mask using the Vtop and Vbase values of the displayed waveform All the threshold coordinates of the mask will be relative to this voltage This is the default mode for mask alignment Eye Boundaries T...

Page 272: ...violations per mask region and the worst BER per Mask region Exit stops the computation hides the mask and the violations Automated Eye Parameter Measurement Table 26 S No Parameter Description 1 Rise...

Page 273: ...the eye diagram If persistence infinite is enabled the value will gradually increase 4 0 Level Zero level is the measurement of the mean value of the logical 0 of an eye diagram Note Thismeasurementis...

Page 274: ...ngs in the Configure Measurement dialog box These settings determine whatportionoftheeyewill be measured 6 Eye Amplitude The difference between the logic 1 level and the logic 0 level 7 Eye Width The...

Page 275: ...l width of the histogram at the eye crossing point with respect to BER threshold Note The Jitter P P is calculated according to the BER Threshold set in the BERT from Calculate Measurement Parameters...

Page 276: ...d by the difference between the 1 and 0 level The noise is the combined standard deviations of the 1 level spread and the 0 level spread 13 Extiction Ratio Extinction ratio is the ratio ofthe1levelpow...

Page 277: ...it and a 0 bit 16 Average Power The mean of level 0 power and the level 1 power Note The Average Power is calculated using the Dark Level and Conversion Gain of the View Tab Eye Diagram Screen This gr...

Page 278: ...random noise It informs you about the frequencies of such components and measures their contribution to the total jitter This helps to identify jitter sources and to reduce or eliminate their influenc...

Page 279: ...r information These records are automatically processed The error information is subject to a fast Fourier transform FFT FFT reveals the spectral components and their power Several window algorithms a...

Page 280: ...y a square wave or on off signal has produced the following histogram Jitter caused by a triangle signal shows an even distribution Last but not least the histogram of jitter modulated by a sinusoid e...

Page 281: ...kers and the zoom function assist you when you are analyzing the graph visually The numerical results include bit error rate total power and noise power They provide also frequency and power informati...

Page 282: ...ght shift decreasing right shift increasing left shift decreasing left shift Signal without jitter Expected and correctly sampled data Periodical sinusoid jitter Signal with jitter Captured data Error...

Page 283: ...reveals the absense or presence of deterministic jitter Dominant frequency components become visible and their contribution to the total jitter can be measured The modified error signal is subject to...

Page 284: ...gies for Jitter Specifications National Committee for Information Technology Standardization NCITS T11 2 Project 1230 Rev 10 June 1999 Yi Cai Bernd Laquai Kent Luchman Jitter Testing for Gigabit Seria...

Page 285: ...epresentative section of an endless periodic signal It assumes that time records can be seamlessly concatenated If this is not the case a phenomenon called leakage occurs Leakage makes it impossible t...

Page 286: ...please note No window removes leakage completely Every window reduces the spectral power Results obtained from different devices can only be compared if the same window is used Spectral Jitter Proced...

Page 287: ...nformation 7 Set up the error detector so that the input range and the termination matches the pattern generator s levels Select Normal as the Active Input an Input Range of 1 3V and set the Data Term...

Page 288: ...ialog box 2 Use the different tabs in this dialog box to make the required settings Parameters tab These settings are used for data collection Changes require to run the test again See Parameters Tab...

Page 289: ...page you have to rerun the measurement to update the results Set the data acquisition parameters Acquisition Depth Suitable numbers can be chosen from the drop down list The Acquisition Depth determin...

Page 290: ...ing signal If you have set the sampling delay manually this is the time offset from that point This option allows you to fine tune the sampling point The unit is UI unit intervals This makes the setti...

Page 291: ...s generally reduce the measured spectral power For an introduction to FFT windows see Leakage and Windowing on page 285 Pass Fail Tab The Pass Fail tab of the Properties dialog box allows you to speci...

Page 292: ...s or fail decision Bit Error Rate Total Power in dB Noise Power in dB You can also define the pass fail criteria for each of the defined frequency ranges In the tabular view each of the calculated val...

Page 293: ...scale is well suited for identifying large peaks in the spectrum The View tab allows you to change the power scale from linear to dB The dB scale is a logarithmic scale The dB scale allows you to exa...

Page 294: ...e frequency bin Relative The following figure shows an example where the scale and the power values have been normalized to the power measured at 1 MHz When you set the power values to relative this c...

Page 295: ...splay according to your needs Choose between logarithmic and linear scale for displaying the frequencies Display the power either in a logarithmic dB or linear scale Show the entire frequency range or...

Page 296: ...Total Power Noise Power The Frequency and total power for up to the 16 frequencies with the highest total power You can set the number of top frequencies to be evaluated in the View tab see View Tab...

Page 297: ...eye height and width of the incoming data signal at specific alignment BER thresholds This information is displayed on a representation of an eye diagram Instantaneous Measurements Instantaneous Measu...

Page 298: ...streams For example if your device is designed to turn off in response to a high BER you can check if your device behaves as expected And you can observe what the BER is prior to data loss See Pattern...

Page 299: ...w to Monitor the BER Results There are different ways how you can monitor instantaneous BER values 1 Listen to the BER warning tones See Audio Signals Procedures on page 156 for details 2 View the BER...

Page 300: ...on or if no accumulation is running the results of the most recent accumulation This enables you to monitor real time BER behavior as you do things such as to manually adjust the sampling point to add...

Page 301: ...we don t want the software to be locked Status messages displays a one line instrument status or error message Click the More button to open an Error Message dialog box with the complete message This...

Page 302: ...e measurement setup as the measured bit errors do not represent the performance of your DUT under real circumstances The period of time can be set by manual start and stop commands an absolute time se...

Page 303: ...front panel This causes the following events If Prompt for File Name has been selected during setup you will be asked to enter a name for the log file before accumulation begins The data display in th...

Page 304: ...you determine the cause of bit errors Bit errors can be caused by a variety of problems In addition instrument settings can affect how errors are measured and displayed The sync mode setting has the g...

Page 305: ...isplay the x axis time scale will double The data graph is then occupying only half of the display and will continue to move to the right again This will repeat until the accumulation period has ended...

Page 306: ...Accumulated Results In the Accumulated Results table the following values are listed Bit Count The number of bits considered for the accumulation period is displayed here This may not equal the total...

Page 307: ...part of the available time Percent Unavailability is the ratio of the unavailable seconds to the total gating period expressed as a percentage Severely Errored Seconds The ratio of the total number of...

Page 308: ...econds The number of deciseconds in which errors were measured is displayed here Errored Centiseconds The number of centiseconds in which errors were measured is displayed here Errored Milliseconds Th...

Page 309: ...umulation period lasts for the duration of all bursts the gaps in error counting while the Gate In signal was high will not be included in BER calculations The gaps in error counting will not be consi...

Page 310: ...c and error counting is active A higher percentage is desirable because it indicates that more data is measured during each burst Total Burst Count Total number of bursts received while in burst mode...

Page 311: ...e contour information 3 Change the sampling point in the Sampling Point Setup window See Sampling Point Display on page 135 for details Eye Measurements Reference Eye results are displayed for the Cur...

Page 312: ...erent eye height results Eye height Upper eye edge Lower eye edge N O T E Most oscilloscopes measure eyes differently using statistical data Therefore the eye results of a Serial BERT and an oscillosc...

Page 313: ...is displayed here This threshold was used to define the eye edges and the above eye results Delta Error Ratio The BER measured during the previous 200 ms is displayed here Evaluating Results 6 Agilen...

Page 314: ...6 Evaluating Results 314 Agilent J BERT N4903 High Performance Serial BERT...

Page 315: ...the presence of jitter It comes in two varieties Jitter Tolerance Characterization determines the jitter levels where the device under test can no longer maintain a desired bit error ratio BER Jitter...

Page 316: ...r composition the jitter frequency spectrum the combination of jitter frequencies and data rate Various test standards specify the jitter composition to be used for jitter tolerance tests The Serial B...

Page 317: ...Characterization Concepts on page 338 PLL Standards and Compliance Tests The Optical Internetworking Forum OIF as well as other institutions have proposed standards for testing the performance of dat...

Page 318: ...ussian distribution but this distribution is cut bounded at both sides This kind of jitter can be caused for example by crosstalk on a parallel bus or by intersymbol interference of random or long pse...

Page 319: ...0ps This kind of jitter can be picked up from any adjacent signal or clock The jitter histogram has a U shape Triangular jitter is always generated by a spread spectrum clock but can also be caused by...

Page 320: ...and backplanes It cuts off higher frequencies and hence changes the shape of the eye opening Intersymbol interference can be simulated by inserting a defined transmission path between the pattern gen...

Page 321: ...led Sinusoidal Interference SI Total Jitter Total jitter is the sum of all kinds of jitter Edge level and shape variations impact width height and symmetry of the eye opening An example is shown below...

Page 322: ...sources can be individually switched on or off This is a special modulator that modulates the generated clock with a low frequency signal The resulting jitter superimposes all other jitter components...

Page 323: ...ine Interference Channel The option J20 Interference Channel is available for simulating intersymbol interference ISI with or without sinusoidal interference SI This is a hardware module that can be p...

Page 324: ...bled if sinusoidal interference shall be added to the signal In this case the minimum trace is longer refer to the technical specifications Data can be input by connecting the pattern generator s Data...

Page 325: ...Line Status and Switch Area The switch is a button that can be pressed It switches the periodic jitter source to either the 500 ps or the 200 ps delay line The delay lines show markers which indicate...

Page 326: ...off The Overview column consists of buttons that can be pressed to change the parameters of each jitter type independently from others Jitter Setup Procedures Do the following to compose the desired j...

Page 327: ...ttern Generator it continues even if the Jitter Enable checkbox is off Select the Delay Line To select the delay line for periodic jitter press the switch N O T E The 500 ps delay line cannot be used...

Page 328: ...al jitter source by pressing its checkbox you will find that this apparently consumes the whole free capacity of the delay line at the right hand side of the red bar But this is just an indication You...

Page 329: ...her the 500 ps or the 200 ps delay line N O T E The 500 ps delay line cannot be used for data rates above 3 37 GHz Delay Line Display The delay line display shows red markers that indicate the consump...

Page 330: ...each jitter type independently from others The Overview button can be used to return after changing parameters Random Jitter Parameters The random jitter Amplitude must be entered as an rms root mean...

Page 331: ...ne capacity the setting consumes The random jitter source is equipped with a 10 MHz high pass and a 500 MHz low pass filter to limit the spectral range Both filters can be disabled or enabled by press...

Page 332: ...e PRBS polynomial is 231 1 the low pass filter is 100 MHz Enter an appropriate Data Rate Refer to the technical specifications The maximum peak to peak Amplitude is limited by the free capacity of the...

Page 333: ...lay line The maximum Frequency of the periodic jitter source depends on the chosen waveform Refer to the technical specifications You can switch between sine rectangular or triangular jitter source wa...

Page 334: ...ensure that this signal does not exceed the maximum voltage N O T E TheDelayControlInputhasanovervoltageprotection Fordetailssee DelayControl Input Concepts on page 97 The Slope indicates the present...

Page 335: ...ut and Trigger Output ports can be connected before or after the clock modulator the Subrate Clock Output always follows the clock modulator When this checkbox is enabled the Clock Output provides and...

Page 336: ...the chosen length the module generates a reproducible amount of intersymbol interference The Interference Channel provides also a sinewave generator and a modulator If sinusoidal interference amplitud...

Page 337: ...nnel module must be enabled before it can be used This is done by clicking the corresponding checkbox When the Interference Channel is disabled it establishes an almost direct connection between P1 an...

Page 338: ...ode noise Differential Requires that a differential data signal is generated and connected to P1 P1 or P2 P2 of the Interference Channel In differential mode both components of the differential data s...

Page 339: ...display the results After a measurement has exceeded the target BER or when moving to the next frequency point a measurement settling or relax time can be applied This allows the DUT to settle after...

Page 340: ...roceeds with the next amplitude as soon as one of the two numbers is reached But we are often dealing with very small tolerable bit error ratios 10 12 and below Measuring such a bit error ratio precis...

Page 341: ...hmic steps from maximum to minimum or vice versa Minimum and ratio are adjustable Alternatively you can also specify one of two dynamic binary search methods Searching Down Up Both search directions u...

Page 342: ...er frequency range you measure many useless points with the downwards upwards methods To construct the tolerance curve we actually need only the two points between which the measured result turns from...

Page 343: ...orithm changes the direction and continually halves the step size This continues until the specified coarse step size is reached Then the coarse step size is maintained until a transition from green t...

Page 344: ...set of logarithmically equidistant frequencies In Manual mode the automatically calculated jitter frequencies can be edited You can also enter your own comma separated list of frequencies The Show Com...

Page 345: ...R on page 340 If you enable AbsoluteBits Errors the measurement proceeds with the next amplitude as soon as one of the two numbers is reached 3 If desired set a Relax Time For details see Relax time o...

Page 346: ...at the beginning or end of the test To avoid clock loss the sinusoidal jitter component has to be enabled Since the sinusoidal jitter for the test is generated internally the jitter amplitude must be...

Page 347: ...tector The device can now be tested without clock loss N O T E When SSC is enabled the measurement does not use SJ The maximum available jitter amplitude is reduced for the jitter tolerance measuremen...

Page 348: ...king on Set updates the Jitter Setup page with the jitter setting of that point Generate HTML Report The measurement results can be saved as HTML file To generate the HTML report 1 Click the Jitter ta...

Page 349: ...it the automatically calculated frequencies You can also enter a single frequency or your own list of frequencies For example you can jump between low and high jitter frequencies Enter the frequencies...

Page 350: ...tter Tolerance Properties dialog you specify how the measurement proceeds upwards or downwards from one measured point to the next The chosen method impacts the measurement duration The specified para...

Page 351: ...t in a sequence of 0 1 UI 0 15 UI 0 225 UI 0 3375 UI and so on The test for one frequency stops when the BER limit is crossed or the maximum amplitude which depends on the jitter frequency is reached...

Page 352: ...m OIF and other institutions have proposed and published standards for testing the performance of data receivers and receiver circuits in the presence of jitter These standards prescribe the required...

Page 353: ...ed cross indicates that the BER at this point exceeded the target BER If this happens the test is marked as failed A table below the graph provides details about the measurement conditions like date t...

Page 354: ...measurement cannot be executed if jitter generation is totally disabled SJ and PJ may be enabled or disabled N O T E SJ and SSC Spread Spectrum Clock option J11 operate mutually exclusive If you run...

Page 355: ...approach is based on statistics Statistics tell us for example that if we receive 3 1012 bits without any error the probability that the BER is below 10 12 is higher than 95 If an error occurred more...

Page 356: ...fine the jitter tolerance curve as a function of the bit rate If this is the case the edges of the jitter tolerance curve are shifted towards higher frequencies if the bit rate is increased and vice v...

Page 357: ...1 234e4 10 cr lf 10 654e6 0 2 cr lf 18 333e6 0 2 cr lf cr lf stands for carriage return line feed or just Return N O T E The list must be sorted according to the frequencies in ascending order The jit...

Page 358: ...Hz to 20 MHz you can select a checkbox to adjust the jitter frequency range to the loaded standard You can also specify the number of points to be measured By default the measurement points are evenly...

Page 359: ...er panel To set up a Jitter Tolerance Compliance test press the Properties button This opens the Jitter Tolerance Properties dialog Setting the Standard Select either a predefined standard or load a s...

Page 360: ...A preview and a short description of the selected standard are displayed 2 To load a different standard open the list 7 Jitter Tolerance Tests 360 Agilent J BERT N4903 High Performance Serial BERT...

Page 361: ...ply to Predefined Standards to load the data and add the standard to the list of predefined standards For details see Adding a User Defined Standard on page 366 If you wish to increase the stress on t...

Page 362: ...hange and to update the frequency list 2 If desired change the default values For example if only a certain frequency range has to be tested Enter the Start Frequency and the Stop Frequency 3 Set the...

Page 363: ...cy list is edited in Manual mode the Auto Frequencies checkbox on the Standard tab is automatically deselected Setting the BER Limit 1 Set the Target Bit Error Ratio This defines whether a measured po...

Page 364: ...t is essential to prevent clock loss at the beginning or end of the test To avoid clock loss the sinusoidal jitter component has to be enabled Since the sinusoidal jitter for the test is generated int...

Page 365: ...ncy and BER press the Start button to run the test The bar in the lower right hand corner of the screen shows the progress You can also abort the test at any time by pressing the Abort button When the...

Page 366: ...ve it Managing User Defined Standards User defined standards are saved in the folder C N4903A JTolStandards The extension is jcs To add a user defined standard to the list 1 Press the Properties butto...

Page 367: ...e for later use in the user interface 1 After your measurement has finished and the results are displayed select Save Measurement from the File Save menu 2 Select a proper file name and location and p...

Page 368: ...ntains all predefined standards including user defined standards The shape of the selected standard is shown in the preview area The frequency range and the jitter amplitude range of the standard is g...

Page 369: ...el range for the DUT as given in the standard Voltage Level at PG recom This is the recommended output level at the pattern generator to achieve the minimum voltage Level from Standard N O T E This re...

Page 370: ...s logarithmic Number of Steps The Number of Steps between start and stop defines the test frequencies The location of the individual test frequencies depends on the setting of the Auto Frequencies che...

Page 371: ...received bits or the number of errors is reached N O T E Ensure that you capture a number of bits that suffices to verify with the desired probability that a measured point has a BER below the Target...

Page 372: ...ed or failed Date and Time when the test was finished Margin that was set for the test Further test Conditions like the selected test pattern and additional jitter components Double click Modify Comme...

Page 373: ...141 0 3095934689654 3015843724 0 0 passed 1086478 592045 0 1728980224511 3015843725 0 0 passed 1875000 0 1 3013355405 0 0 passed 1945462 831206 0 1 3015843721 0 0 passed 3483571 287383 0 1 3015843721...

Page 374: ...7 Jitter Tolerance Tests 374 Agilent J BERT N4903 High Performance Serial BERT...

Page 375: ...evice cancel the hardware wizard and reboot the instrument This might happen if the front panel controller is not initialized correctly at boot up Incorrect Error Detector Input Voltages The error det...

Page 376: ...eral error indicators to help you identify setup problems The following list contains possible causes for setup problems sorted from the most severe to the least severe PG CLK LOSS This indicator turn...

Page 377: ...red BER is higher than the sync threshold BERT connected looped back or to your device The sampling point is incorrect Use Auto Align The data pattern is inverted Toggle Data Inverted or use Auto Alig...

Page 378: ...gh errors may be caused by faulty connectors cables BERT connected to your device Stable or variable errors can also be caused by your device Correct the problems with your device If the problems are...

Page 379: ...s 50 of the time with the PRBS pattern Therefore at the serial rate one out of every 512 bits was measured as an errored 0 1 256 50 1 512 In addition the inverse of the error ratio was a multiple of...

Page 380: ...veform Noise can be caused by bad cables or connectors The output of your device may contain errors due to noise although a noisy waveform is not present at the output The noise may originate somewher...

Page 381: ...When the clock signal resumed the received and ED reference patterns could only be aligned if the synchronization functions were activated In manual sync mode this would not have happened because sync...

Page 382: ...ion has an import wizard you may need to indicate that data is delimited with commas 4 Once the file has been imported you may need to resize columns The imported log file should appear similar to the...

Page 383: ...RED 1 COUNT Cumulative ERRORED 1 RATIO ERRORED 1 RATIO Cumulative SYNC LOSS ERROR SECONDS Cumulative PG CLOCK LOSS ERROR FREE SECONDS Cumulative ED CLOCK LOSS ERROR DECISECONDS Cumulative DATA LOSS ER...

Page 384: ...rning message respectively N O T E The temperature level is not yet critical However the Serial BERT may be damaged if operation is continued The message is intended to inform you to take the appropri...

Page 385: ...tilation holes are not blocked If the problem continuously recurs contact Agilent support C A U T I O N Do not operate the Serial BERT before it has cooled down again Otherwise your instrument may get...

Page 386: ...ge 407 Check the Power Supply Ensure that the power cord is connected The green LED close to the power switch must be illuminated when the unit is turned on Check the USB Communication Ensure that the...

Page 387: ...ld indicate an instrument named UsbDevice1 If the N4916A has been installed correctly the VISA Assistant should indicate an instrument named D4916 Click UsbDevice1 or D4916 5 Click the Formatted I O t...

Page 388: ...oftware can Access the N4916A 1 From the Windows task bar restore the user interface click GUI Agilent 4900 Series 2 Press the green Preset key close to the front USB connector of the Serial BERT or f...

Page 389: ...eld there is no connection to the N4916A Check the Output of the N4916A Using a Scope 1 Set the Data offset to 0 V and the amplitude to 1 V Set the De Emphasis to 6 dB 2 Connect the Output of the N491...

Page 390: ...ta Offset to 0 V and the Amplitude to 1 V Set the De Emphasis to 6 dB 2 Press ED Setup and open the Sampling Point Setup page 3 Set up the error detector Press the Edit button to enter the ED Input Se...

Page 391: ...ith a Scope If the N4916A does not produce a signal check the Data Out of the Serial BERT Connect the Data Output of the pattern generator to an oscilloscope N O T E As long as the N4916A is in connec...

Page 392: ...put of the pattern generator by means of the error detector 1 Set up the pattern generator as described above Set the Data Offset to 0 V and the Amplitude to 1 V 2 Set up the error detector as describ...

Page 393: ...After some seconds you should see an eye diagram like the following This is the eye of a non distorted pattern Solving Problems 8 Agilent J BERT N4903 High Performance Serial BERT 393...

Page 394: ...8 Solving Problems 394 Agilent J BERT N4903 High Performance Serial BERT...

Page 395: ...diskette at your system Store the diskette on a safe place and use it to restore the operating system to its factory state C A U T I O N When the operating system is restored all personal settings pro...

Page 396: ...substitute for Windows XP Setup Boot Disks How to Restore the Operating System 1 Turn off the instrument and connect a keyboard and mouse to the instrument See Connecting Peripherals on page 399 for...

Page 397: ...e carried out even if the software does not match the hardware In this case the instrument may go into a corrupt state or not all features may be available The applicable hardware versions are listed...

Page 398: ...ce Bus address You can change this address by doing the following 1 On the Utilities menu click Change GPIB Address This starts the GPIB Address Change dialog box 2 Select an address in the New GPIB A...

Page 399: ...l They support 10 Base T and 100 Base T Ethernet networks using TCP IP and other Microsoft supported networking protocols The Serial BERT uses Microsoft XP Pro For detailed instructions on how to enab...

Page 400: ...2 Select an address from the New GPIB Address list 3 Click OK The new address will be applied and the dialog box will close Each instrument must be set to a unique GPIB address to avoid multiple instr...

Page 401: ...2 Minimize the Serial BERT user interface window 3 In the system tray next to the clock in the lower right corner right click the TouchscreenSettingsicon to open the menu with the available options 4...

Page 402: ...board from the Utilities menu A check mark appears next to the menu entry indicating that it has been selected Using an External Monitor To switch between the Serial BERT s built in display and an ext...

Page 403: ...agging it Additionally you can switch between different views of the on screen keyboard The following table lists the displayed buttons for the different views Table 28 Softkeys Letters Numeric Charac...

Page 404: ...ick Licenses The Licenses dialog informs you about the options that require a license 2 Record the HOST ID MAC Addr shown in the window This is the MAC Address of the Serial BERT 3 Contact your Agilen...

Page 405: ...ument you need another license file N O T E License handling is only available if both NIC Network Interface Card Adapter are enabled Install License The Install License dialog is used for installing...

Page 406: ...ded by the operating system 2 Disconnect the instrument from mains C A U T I O N Neverpluginorremoveamodulewhiletheinstrumentisconnectedtomainspower 3 Unscrew and remove the slot cover 4 Insert the mo...

Page 407: ...P2 to the Data Out of the Pattern Generator P1 provides the output C A U T I O N The module has golden 2 4 mm connectors Be sure to use the specific cables or adapters for the connections Improper co...

Page 408: ...re supports the N4916A on from revision 4 8 1 Switch on the Serial BERT 2 In the Help menu click About 3 If the software revision is below 4 8 you need to update the software see Updating the Software...

Page 409: ...ut item to check the details If you wish to update the Agilent IO Libraries Suite you can download the software from http www agilent com find iolib Installation instructions are given in the associat...

Page 410: ...ble between the USB ports at the rear sides of the N4916A and the Serial BERT You can use any rear port of the Serial BERT 3 The Found New Hardware Wizard will pop up and ask whether he should connect...

Page 411: ...uires a specific VISA alias name to access the N4916A The Agilent Connection Expert is available on from revision 14 0 of the Agilent IO Libraries Suite 1 If the Agilent Connection Expert does not pop...

Page 412: ...of the Agilent IO Libraries Suite Documentation Agilent IO Config is provided up to revision M 01 of the Agilent IO Libraries 1 If Agilent IO Config does not pop up automatically click the Agilent IO...

Page 413: ...04 cable or a 2 4 mm cable m m longer than 350 mm and connect the pattern generator s Data Out port to the Input port of the N4916A 2 Mount the SMA 50 Ohm termination on the unused Data Out port of th...

Page 414: ...data and make measurements The second technology is that of the World Wide Web and the web browser User data gathered across target user groups support the hypothesis that the great majority of Electr...

Page 415: ...d and install the Web Server N O T E The current J BERT instrument can be upgraded to the Web Server enabled software Follow the steps below to install the web server on the instrument 1 Find webserve...

Page 416: ...u can request for help by pressing the Help button on the lower right hand corner 5 The instrument IP will be automatically generated in the space labeled Instrument IP Address While adding the instru...

Page 417: ...ient computer you cannot access the GUI of the instrument If Framework 2 0 is installed on the instrument you need to uninstall it Framework 2 0 comes with the WebServer installation 1 Open a web brow...

Page 418: ...Printer Wizard dialog box 2 Click My Computer for a local printer installation or click Network printer server for a printer connected to another server N O T E Before you can add a network printer y...

Page 419: ...ent to the default printer unless you explicitly select another printer To specify the default printer 1 On the File menu click Print Setup then Configure Printer This opens the Printers dialog box 2...

Page 420: ...faults Click this option to change such items as pages per sheet print quality paper select and portrait vs landscape layouts 4 Select Close in the File menu of the Printers dialog box The new setting...

Page 421: ...USB stick To avoid loss of data when removing the USB stick 1 Minimize the GUI 2 In the system tray next to the clock in the lower right corner right click the Safely Remove Hardware icon A window co...

Page 422: ...loppy disk Each instrument state uses approximately 6 kB of disk space T I P Remember to always make a backup copy of your files If your original files are damaged or lost you can restore the files fr...

Page 423: ...columns The imported log file should appear similar to the following example N O T E During measurement logging the Serial BERT logs data in ten second intervals Your log file may be missing up to th...

Page 424: ...in either of the following ways Click the Save icon on the Pattern Editor toolbar If the pattern has not been saved earlier a file dialog box opens that allows you to navigate the file system and name...

Page 425: ...bmp 256 color bitmap file format file Follow the steps below to view screen images on an external PC 1 Copy the screen image file from the Serial BERT to your PC By default image files are saved in th...

Page 426: ...log box you can select additional self tests that will run when you click Run Test N O T E During accumulation or while auto search functions are in progress Self Test is not available The pass fail r...

Page 427: ...gisters of the pattern generator are available and accessible Pattern Generator Auto Calibration This test runs a timing calibration that calibrates the clock to data alignment of the pattern generato...

Page 428: ...u selected tests that need a longer time to complete a message box opens Confirm your selection by clicking OK A second message box is informing you while the test is still running and closes when fin...

Page 429: ...it Rate Range Error Detector 119 Bit Recovery button 135 Bit Recovery Mode enable 131 explanation 128 Bounded uncorrelated jitter BUJ 318 Bracketing Approach 180 BRM 128 BUJ 318 Burst Results 309 Burs...

Page 430: ...0 External Signal 100 Manually 99 Error Location Capture measurement 236 Error Out port 112 Estimated Total Jitter 193 Example of an Output Level Measurement Changing Properties 202 Improving the Disp...

Page 431: ...43 Measurements 297 Memory based Patterns 23 Min BER for Q 209 More Errored 0 s than 1 s 379 MUX DEMUX Pair Connections 20 N N4916A 12 Basics 77 Connections 22 control 81 Installation 407 Troubleshoot...

Page 432: ...t 9 Post cursor de emphasis 78 Power scale 293 PRBN 25 PRBS 24 PRBS Patterns 23 Pre cursor de emphasis 78 Printing 418 Problems 375 Constant Errors More Errored 0 s than 1 s 379 Random Errors 380 Sync...

Page 433: ...l Eye Opening measurement 230 High Level Output Levels measurement 204 Low Level Output Levels measurement 204 230 Threshold Types 247 Time Eye Opening 235 Timing Unit Eye Opening measurement 234 Fast...

Page 434: ...Index 434 Agilent J BERT N4903 High Performance Serial BERT...

Reviews: