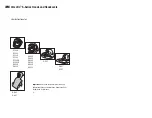
where
Mean
is the High Level of the terminal.
•
Low Level Std. Dev.
The Low Level Standard Deviation is calculated as:
where
Mean
is the Low Level of the terminal.
•
Peak Peak Noise
The peak-to-peak Noise is calculated as:
Note that the Threshold Margin depends on the position of the
BER
Threshold
.
•
Signal/Noise Ratio (RMS)
The RMS Signal-to-Noise Ratio is calculated as:
•
Signal/Noise Ratio (Peak Peak)
The peak-to-peak Signal-to-Noise Ratio is calculated as
Note that the Peak Peak Noise depends on the position of the
BER
Threshold
.
The Q-factor result parameters are summarized in the following table:
Table 24
Parameter Name
Pass/Fail
Q Factor
min
Q Optimum Threshold
min/max
Q Residual BER
max
5
Advanced Analysis
212
Agilent J-BERT N4903 High-Performance Serial BERT
Q-factor Results
Summary of Contents for J-BERT N4903
Page 1: ...S Agilent J BERT N4903 High Performance Serial BERT User Guide s Agilent Technologies...
Page 68: ...2 Setting up Patterns 68 Agilent J BERT N4903 High Performance Serial BERT...
Page 158: ...4 Setting up the Error Detector 158 Agilent J BERT N4903 High Performance Serial BERT...
Page 314: ...6 Evaluating Results 314 Agilent J BERT N4903 High Performance Serial BERT...
Page 374: ...7 Jitter Tolerance Tests 374 Agilent J BERT N4903 High Performance Serial BERT...
Page 394: ...8 Solving Problems 394 Agilent J BERT N4903 High Performance Serial BERT...
Page 434: ...Index 434 Agilent J BERT N4903 High Performance Serial BERT...


