


Table 9-8 Graph Options (continued)
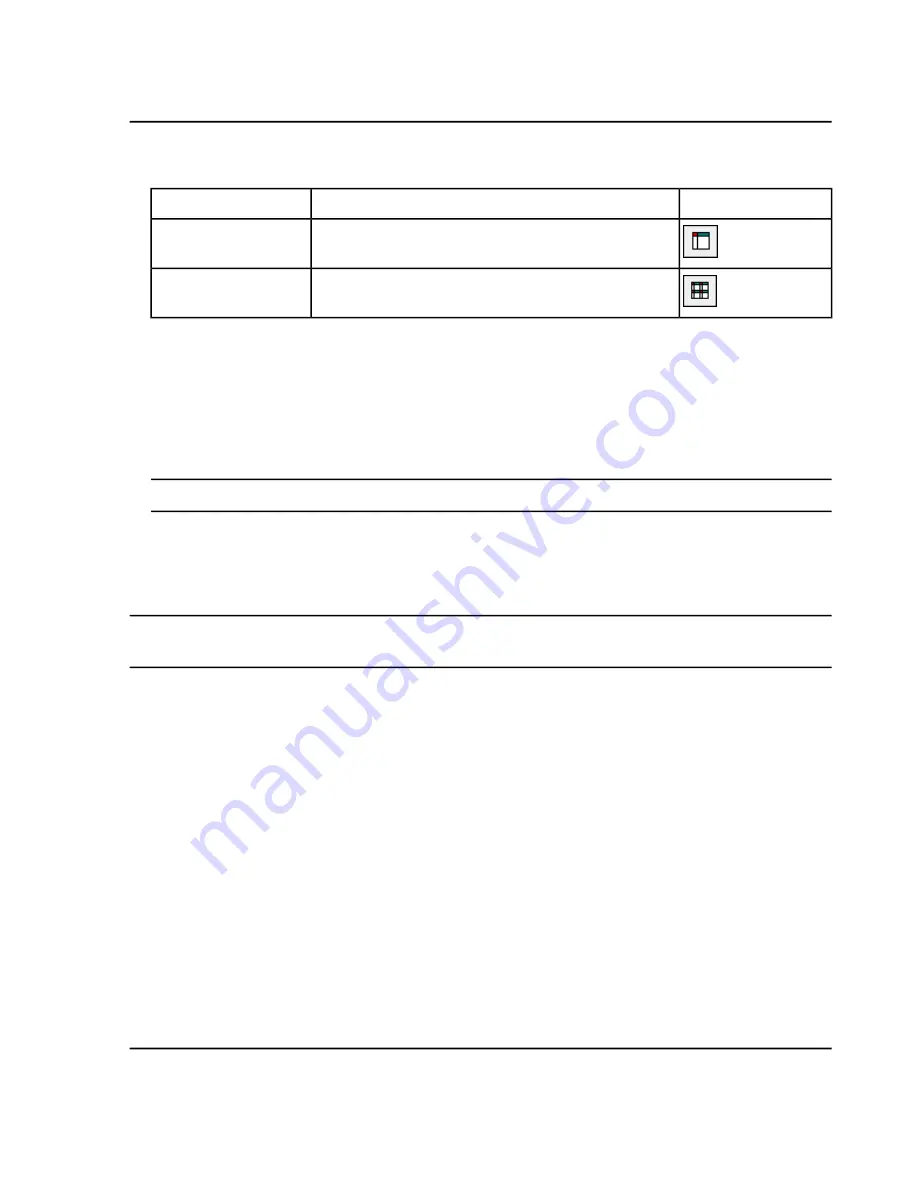
...or click this icon
use this menu option...
To do this...
Select the graph. Click
Window > Maximize Pane.
Maximize a pane
Select the graph. Click
Window > Tile all Panes.
Tile panes
Zoom In on the Y-axis
1. Move the pointer to the left of the Y-axis to either side of the area to be expanded and then drag away from
the starting point in a vertical direction while holding the left mouse button.
A box is drawn along the y-axis representing the new scale.
Note:
Take care when zooming in on the baseline. Zoom in too far and the zoom-in box closes.
2. Release the mouse button to draw the graph to the new scale.
Zoom In on the X-axis
Tip!
To return the graph to the original scale, double-click either axis. To restore the entire graph to the original
scale, click
Explore > Home Graph.
1. Move the pointer under the X-axis to either side of the area to be expanded and then drag away from the
starting point in a horizontal direction while holding the left mouse button.
2. Release the mouse button to draw the graph to the new scale.
System User Guide
TripleTOF
®
5600/5600+ System
RUO-IDV-05-7040-B
92 / 131
Operating Instructions — Analyze and Explore Data


