


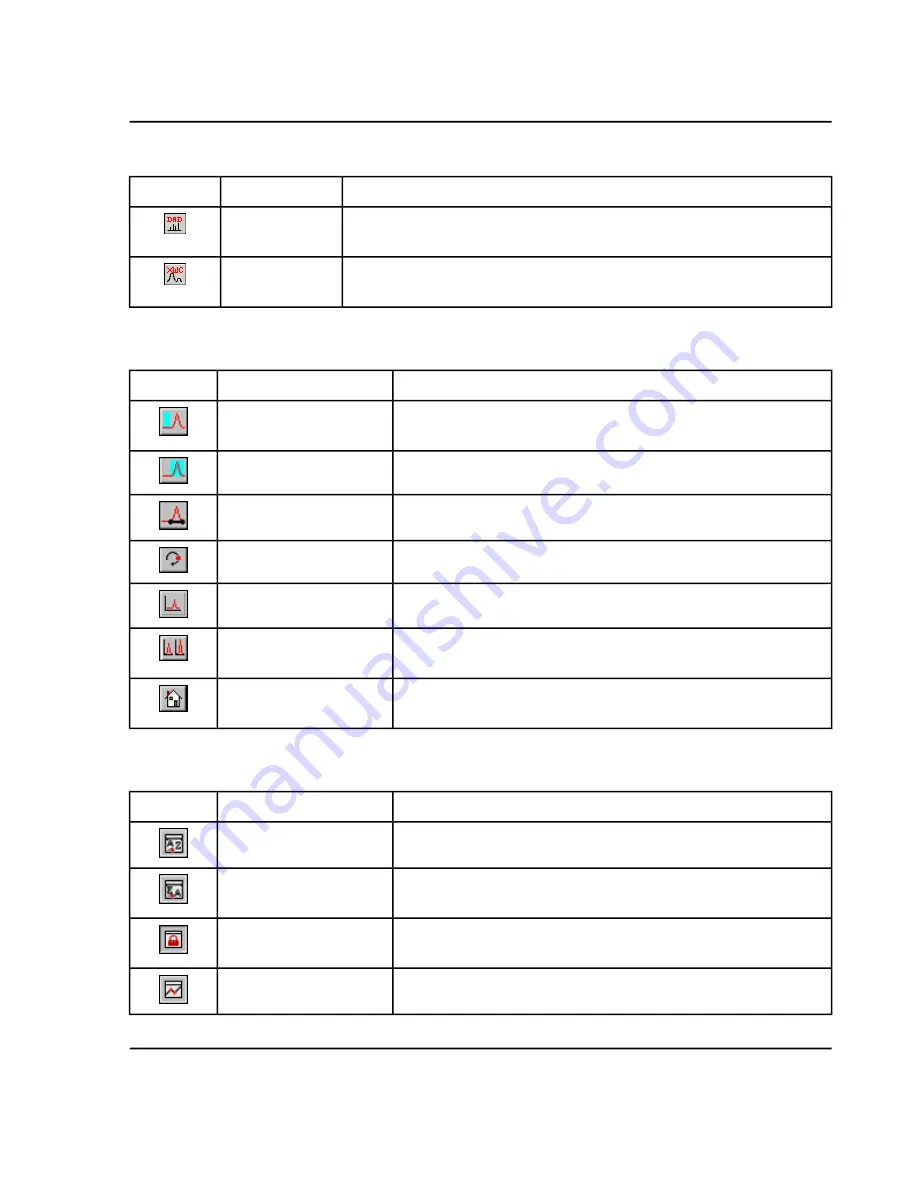
Table C-8 Navigation Icons on the Explore Toolbar (continued)
Function
Name
Icon
Click to generate a DAD spectrum.
Show DAD
Spectrum
Click to extract up to three wavelength ranges from a DAD spectrum to view
the XWC.
Extract
Wavelength
Table C-9 Integration Tab and Quantitation Wizard Icons
Description
Name
Icon
Uses the selected peak.
Set parameters from
Background Region
Uses the selected background.
Select Peak
Manually integrates peaks.
Manual Integration Mode
Toggles the peak-finding parameters between shown and hidden.
Show or Hide Parameters
Shows the analyte chromatogram only.
Show Active Graph
Shows the analyte and its associated chromatogram (available only
when an associated internal standard exists).
Show Both Analyte and IS
Returns to the preset (view all data) view (if, for example, the user
has zoomed in on a chromatogram).
Use Default View for Graph
Table C-10 Results Table Icons
Description
Name
Icon
Sorts the selected column by ascending values.
Sort Ascending by Selection
Sorts the selected column by descending values.
Sort Descending by
selection
Locks or unlocks the selected column. A locked column cannot be
moved.
Lock Or Unlock Column
Creates a metric plot from the selected column.
Metric Plot By Selection
TripleTOF
®
5600/5600+ System
System User Guide
123 / 131
RUO-IDV-05-7040-B
Toolbar Icons


