Appendix E Converting Analysis Data into a Chart Using EXCEL
IV.
OPERATION INSTRUCTIONS
IV .
E - 3
Page
7.
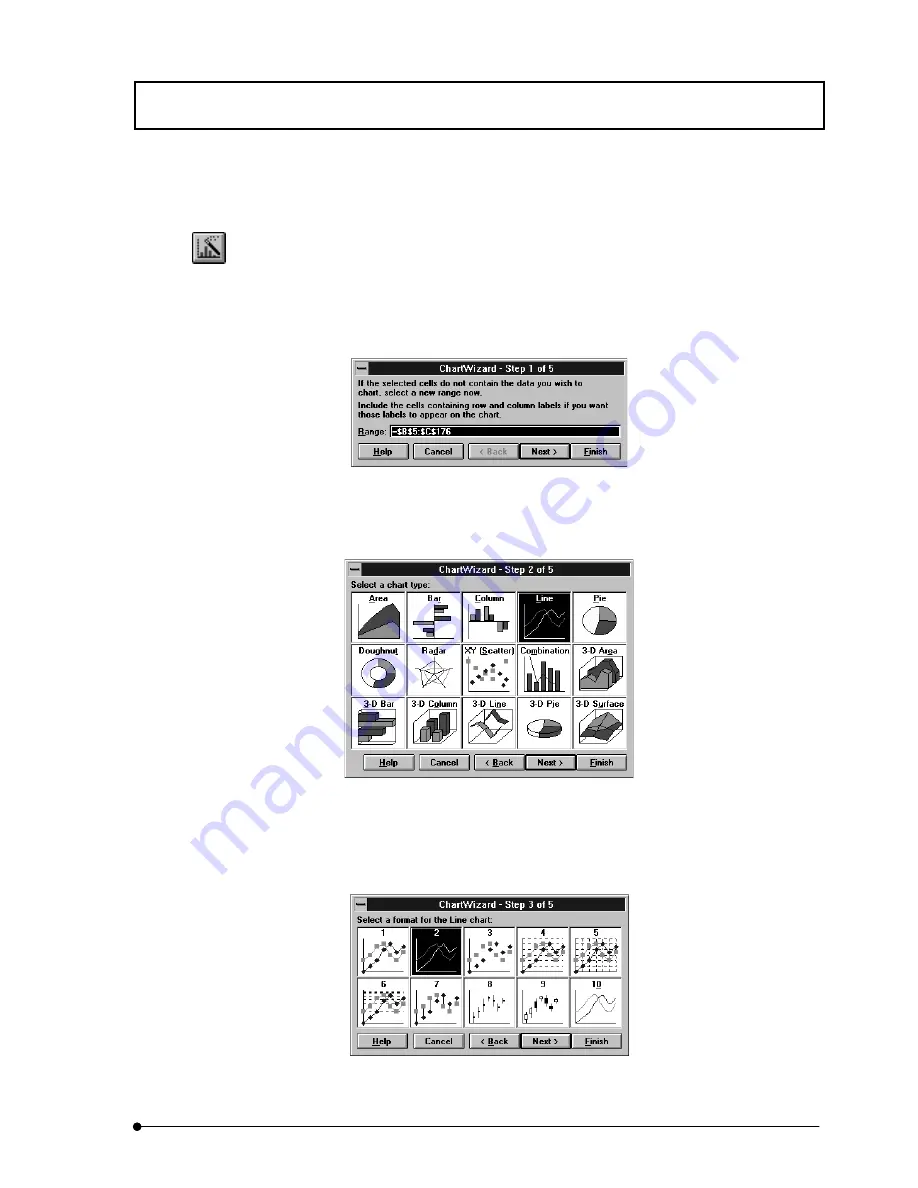
Click the <ChartWizard> button.
8.
On the sheet, drag the area where the chart is to be inserted.
The dialog box as shown below appears.
Fig. Appendix E-4 Dialog Box of Chart Wizard (1/5)
9. Click the <Next> button. The dialog box as shown below appears.
Fig. Appendix E-5 Dialog Box of Chart Wizard (2/5)
10. Select the desired chart type and click the <Next> button. The dialog box as shown
below appears.
Fig. Appendix E-6 Dialog Box of Chart Wizard (3/5)
<ChartWizard> button
Содержание FLUOVIEW FV300
Страница 2: ......
Страница 8: ......
Страница 10: ......
Страница 12: ......
Страница 26: ......
Страница 28: ......
Страница 38: ......
Страница 114: ......
Страница 291: ...APPLIED OPERATIONS Protocol processor IV OPERATION INSTRUCTIONS IV 2 1 7 7 Page Fig 2 54 Panel After a Repeated Scan...
Страница 422: ...APPLIED OPERATIONS Viewing 3D Image IV OPERATION INSTRUCTIONS IV 2 3 0 8 Page Fig 2 133 Panel Showing Stereo 3D Images...
Страница 486: ......
Страница 506: ......
Страница 512: ......
Страница 518: ......
Страница 520: ......
Страница 548: ......
Страница 552: ......
Страница 554: ......
Страница 556: ......
Страница 562: ......
Страница 563: ......


