Lake Shore Model 321 Autotuning Temperature Controller User’s Manual
Application Notes
D-17
The utilization of the small signal model has the advantage of being
analytically simple. However, the model does not contain the nonlinearity
inherent in the forward biased IV characteristics of a
p-n
junction. In an attempt
to retain the non linear characteristics, V(I
dc
+ I
ac
cos
ω
t
) was expanded in a
Fourier series. The first term (constant term) is just the average dc voltage in
Eq. (3) and is not seen by the voltmeter operating in an ac measurement
mode. The remaining terms in the Fourier series can then be used to calculate
the rms voltage which will be read by the voltmeter:
V
T
a
n t
b
m t dt
rms
n
m
m
n
T
2
1
1
0
2
1
=
+
L
N
MM
O
Q
PP
=
∞
=
∞
∑
∑
z
cos
sin
ω
ω
(7)
where
a
n
and
b
m
are the Fourier coefficients. In order to evaluate the Fourier
coefficients, V(I) was expanded in a power series around I
dc
. Sufficient terms
were maintained in both the power series expansion and in Eq. (7) to give a
second-order correction to Eq. (5):
V
nkT
e
I
I
I
I
I
I
rms
ac
dc
s
ac
dc
s
=
F
HG
I
KJ
+
F
HG
I
KJ
+
+
F
HGG
I
KJJ
1
2
1
5
16
2
2
1 2
b
g
/
(8)
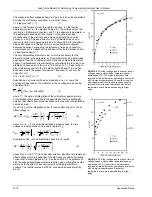
Substitution of this result into Eq. (4) gives the 77 K offset voltages shown in
Fig. 4 by the dashed line. Slightly better agreement with the experimental data
is seen at the higher rms voltages. At 305 K, the two calculation methods are
in even better agreement and a plot similar to Fig. 4 would show no difference.
The details of the extended calculation have not been given as the
mathematics is somewhat tedious, and the slight discrepancies between the
small signal model and the extended model do not justify the added
complexity. For all practical purposes, Eq. (6) can be reliably used above 40 K.
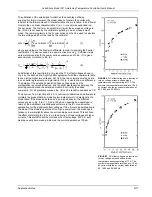
The physics of a p-n junction at 4.2 K is not clearly understood and attempts to
correlate the present data by modeling low-temperature IV characteristic of a
diode failed. If the diode does take on a p-i-n type behavior, the different
curves shown in Fig. 5 for 1, 10, and 100 µA can possibly be understood in
terms of the additional current-dependent terms in the IV curve.6 Another
explanation for the significant offset voltage at 100 µA could be self-heating in
the diode. If the diode is operated at too high a power level, the diode has a
tendency to warm slightly above the surrounding environment. This will have
the effect of distorting the IV curve in the direction of lower voltages at higher
currents. This distortion will then increase the offset voltage. At 4.2 K, self-
Heating usually becomes a problem as the current approaches 100 µA.
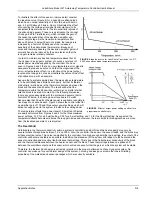
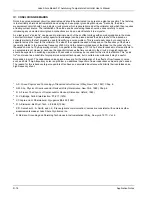
FIGURE 6.
DC offset voltage as a function of
rms ac voltage across a silicon diode
temperature sensor operating at 77 K. The
symbols represent data recorded at a 10 µA
dc current with the ac current modulation at
60, 1000, and 20,000 Hz.
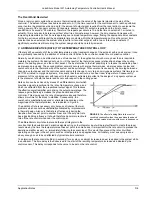
FIGURE 7.
DC offset voltage as a function of
rms ac voltage across a silicon diode
temperature sensor operating at 77 K. The
symbols represent data recorded at a 10 µA
dc current with the ac current modulation at
60, 1000, and 20,000 Hz.

