130
_____________________________________________________________________________________________
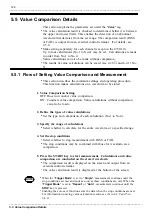
5.5 Value Comparison Details
______________________________________________________________________________________________
周波数
1/T
1
[Hz]
周波数
1/T
2
[Hz]
周波数
1/T
3
[Hz]
周波数
1/T
4
[Hz]
指定レベル
Frequency
1/T
4
[Hz]
Frequency
1/T
3
[Hz]
Frequency
1/T
2
[Hz]
Frequency
1/T
1
[Hz]
Specified
level
10%
90%
立ち上がり時間
立ち下がり時間
T
up1
T
up2
T
down1
T
down2
T
up3
Rise-Time Fall-Time
NOTE
When using an inadequate number of points for calculation, note that the
calculation results may not be accurate.
Aカーソル
Bカーソル
斜線部
の面積
Start point of a
calculation
End point of a waveform
operation
Areas of
shaded
sections
S =
n
l di l
h
i = 1
Σ
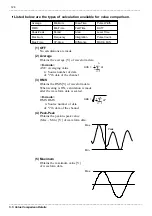
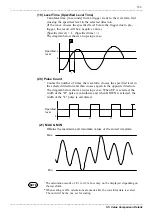
(10) Frequency
Obtains the frequency f (=
1/T) [Hz] of waveform data.
Determines the frequencies
from the intervals between the
points where the waveform
crosses the specified level in
the same slope direction, and
calculates maximum and
minimum frequencies.
The diagram at the right shows an up-slope case.
(Maximum frequency) = max{1/T
i
}(i=1,2,3...)
(Minimum frequency) = min{1/T
i
}(i=1,2,3...)
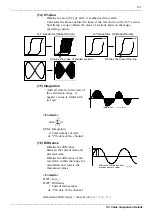
(11) Rise-Time,
(12) Fall-Time
Calculates the 0% and 100%
levels of stored waveform
data using a histogram.
Obtains the rise time from
10% to 90% (fall time from
90% to 10%) [s].
Obtains the Rise-Time (Fall-
Time) of the waveform within
the range for calculation and
selects the maximum and
minimum values.
(Maximum Rise-Time) = max {T
upi
}(i=1,2,3...)
(Minimum Rise-Time) = min {T
upi
}(i=1,2,3...)
(Maximum Fall-Time) = max {T
downi
}(i=1,2,3...)
(Minimum Fall-Time) = max {T
downi
}(i=1,2,3...)
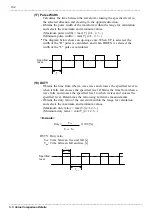
(13) Area
Obtains the areas [V*s] of
sections enclosed within the
zero position (potential of 0V)
and signal waveform.
Specifying a range obtains the
areas of sections between the
range-specifying cursors.
<Formula>
S: Sections
n: Number of data
di: "i"th data of the channel
h =
Δ
t: Sampling Period


