


Section 8. Working with Data Files on the PC
8.2.3.1.7 Ranges
Element numbers may be entered individually (e.g., 2,3,4,5,6,7), or, in groups
(e.g., 2..7) if sequential. Range limits (lower to upper boundary conditions)
may be placed on elements or groups of elements specified in the Select or
Copy lines. For example, 3[3.7..5],4..7[5..10] implies that element 3 is
selected only if it is between 3.7 and 5, inclusive, and elements 4,5,6, and 7
must be between 5 and 10, inclusive.
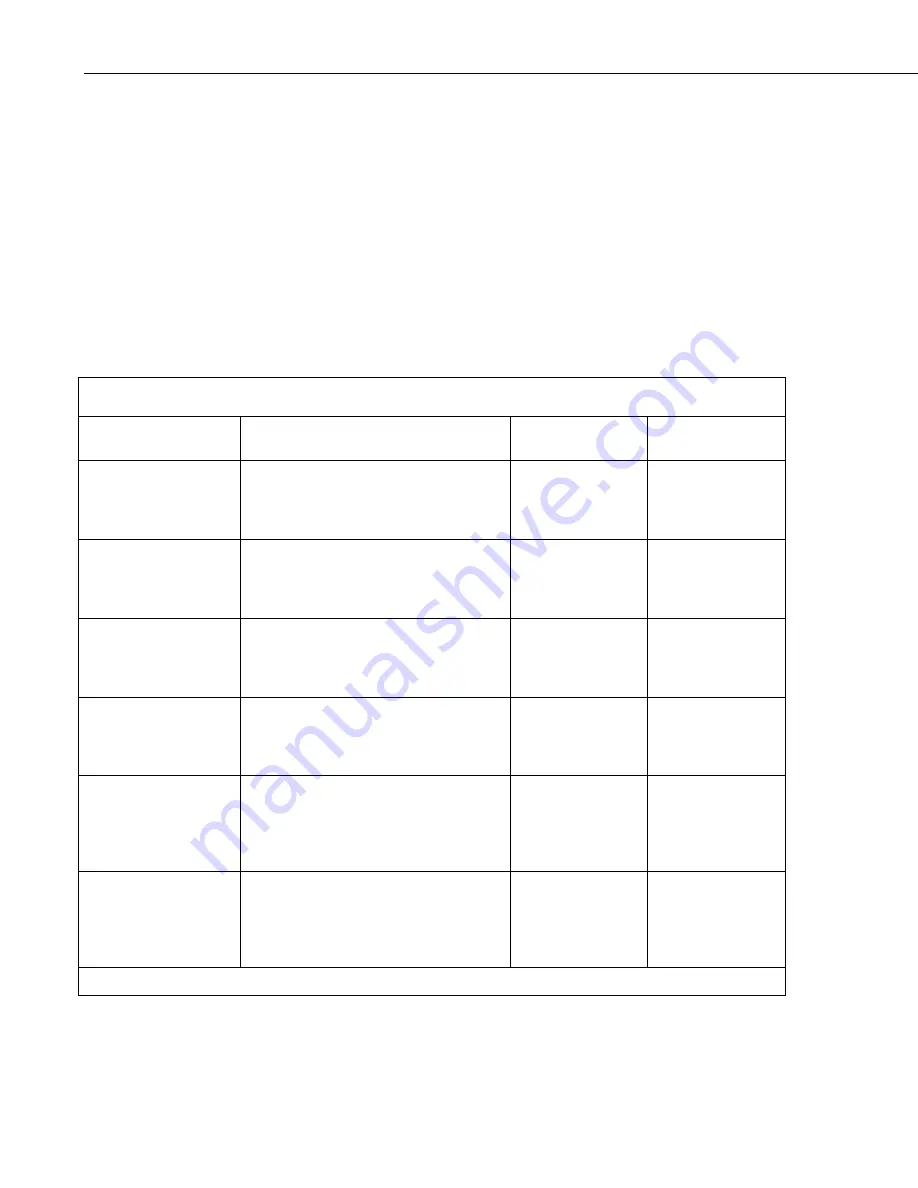
If range limits are used in the Select condition, when Split is run, any data
which are outside of the specified range will be highlighted according to the
options chosen for the output file. TABLE 8-5 summarizes what each option
produces on the screen and in the output file if out of range data are
encountered. This type of range testing is a quick way to identify data
problems.
TABLE 8-5. Effects of Out of Range Values for Given Output Options
Output Option
Screen Display*
PRN File
RPT File or
Printer Output
Report = None; No
other options defined
(default)
bad values displayed in red and preceded
by asterisk; the text “bad data”
highlighted in a red box at bottom right of
screen
blanks inserted for
bad values
N/A
Report = File or Printer;
no other options defined
bad values displayed in red and preceded
by asterisk; the text “bad data”
highlighted in a red box at bottom right of
screen
blanks inserted for
bad values
bad values preceded
by asterisk
Report = None;
replacement text (abc)
in “Replace bad data
with” field
bad values displayed in red and preceded
by asterisk; the text “bad data”
highlighted in a red box at bottom right of
screen
abc inserted in
place of bad values
N/A
Report = File or Printer;
comment in “Replace
bad data with” field
bad values displayed in red and preceded
by asterisk; the text “bad data”
highlighted in a red box at bottom right of
screen
comment inserted
in place of bad
values
bad values preceded
by asterisk
Report = None;
“Display only bad data”
option enabled
only lines with bad data are displayed;
bad values displayed in red and preceded
by asterisk; the text “bad data”
highlighted in a red box at bottom right of
screen
only lines with bad
data output; blanks
inserted for bad
values
N/A
Report = File or Printer;
“Display only bad data”
option enabled
only lines with bad data are displayed;
bad values displayed in red and preceded
by asterisk; the text “bad data”
highlighted in a red box at bottom right of
screen
only lines with bad
data output; blanks
inserted for bad
values
only lines with bad
data output; bad
values preceded by
asterisk
*The Screen Display box must be checked; if not, no data will be displayed on the Split Run screen.
8-54
Содержание LoggerNet
Страница 2: ......
Страница 30: ...Preface What s New in LoggerNet 4 xxvi...
Страница 32: ...Section 1 System Requirements 1 2...
Страница 44: ...Section 2 Installation Operation and Backup Procedures 2 12...
Страница 136: ...Section 4 Setting up Datalogger Networks 4 80...
Страница 227: ...Section 7 Creating and Editing Datalogger Programs 7 9...
Страница 298: ...Section 7 Creating and Editing Datalogger Programs 7 80...
Страница 402: ...Section 9 Automating Tasks with Task Master 9 12...
Страница 406: ...Section 9 Automating Tasks with Task Master 9 16...
Страница 450: ...Section 11 Utilities Installed with LoggerNet Admin and LoggerNet Remote 11 22...
Страница 454: ...Section 12 Optional Client Applications Available for LoggerNet 12 4...
Страница 462: ...Section 13 Implementing Advanced Communications Links 13 8...
Страница 482: ...Section 14 Troubleshooting Guide 14 20...
Страница 570: ...Appendix F Calibration and Zeroing F 16...
Страница 578: ...Appendix G Importing Files into Excel G 8...
Страница 579: ......