Section 8. Working with Data Files on the PC
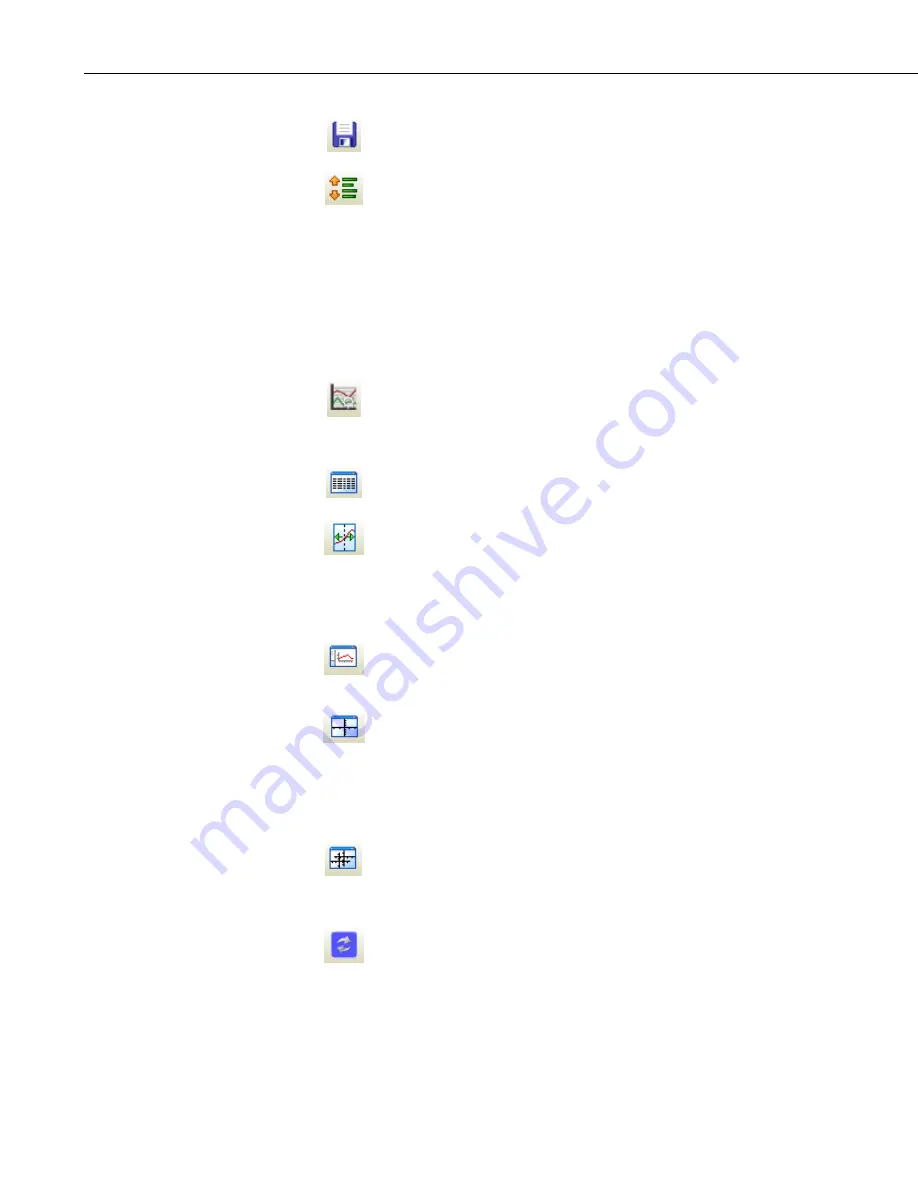
Export
. Allows the graph to be exported in a choice of text or
graphical formats.
Lock Scrolling
. Locks and unlocks the scroll bar at the
bottom of the graph.
When unlocked, moving the scroll bar on either the graph or
the data file will scroll both the graph and the data file.
When locked, the graph will not scroll. However, moving the
scroll bar on either the graph or the data file will still scroll the
data file.
This is a toggle button. When the lock is currently enabled,
there will be a lock on top of the icon.
Graph Options
. Opens a dialog box from which you can set
properties for the graph including colors, margins, titles,
legend, etc. This dialog box can also be brought up by
pressing the
Options
button.
Show Table
. Brings the main View Pro window in front of
other windows, making the data file(s) visible.
Show/Hide Graph Cursor
. A toggle button that shows and
hides the graph cursor. The graph cursor is a vertical line
extending from the top to the bottom of the graph display.
When visible, you can click and drag the cursor across the
graph. Data values at the current cursor position will be shown
in the table.
Show/Hide Gradient
. A toggle button that turns on and off
the gradient background of the graph. It may be useful hide
the gradient, when printing the graph.
(Common)
Common/Independent Axes
. When multiple data values are
being graphed, determines whether they have common y-axes
or independent y-axes.
When using common y-axes, one scale will apply to all traces
assigned to the left y-axis and one scale will apply to all traces
assigned to the right y-axis.
(Independent)
When using independent y-axes, the scale shown will apply
only to the last selected trace assigned to that axis. (A trace is
selected by clicking on its name in the list above the
Edit
and
Delete
buttons.)
Synchronize Axes
. Only enabled when data is being graphed
from multiple data files and all of the data files have an
overlapping time period.
When a graph contains traces from multiple data files, a box
with a drop-down list will appear in the Graph Width options
box. The data file chosen from the drop-down list indicates
which data file and graph will be scrolled by the graph scroll
bar. After using the scroll bar to scroll the indicated graph, the
8-18
Содержание LoggerNet
Страница 2: ......
Страница 30: ...Preface What s New in LoggerNet 4 xxvi...
Страница 32: ...Section 1 System Requirements 1 2...
Страница 44: ...Section 2 Installation Operation and Backup Procedures 2 12...
Страница 136: ...Section 4 Setting up Datalogger Networks 4 80...
Страница 227: ...Section 7 Creating and Editing Datalogger Programs 7 9...
Страница 298: ...Section 7 Creating and Editing Datalogger Programs 7 80...
Страница 402: ...Section 9 Automating Tasks with Task Master 9 12...
Страница 406: ...Section 9 Automating Tasks with Task Master 9 16...
Страница 450: ...Section 11 Utilities Installed with LoggerNet Admin and LoggerNet Remote 11 22...
Страница 454: ...Section 12 Optional Client Applications Available for LoggerNet 12 4...
Страница 462: ...Section 13 Implementing Advanced Communications Links 13 8...
Страница 482: ...Section 14 Troubleshooting Guide 14 20...
Страница 570: ...Appendix F Calibration and Zeroing F 16...
Страница 578: ...Appendix G Importing Files into Excel G 8...
Страница 579: ......


