


4.
PO
WER
SWEEP
LINEARITY
TEST
(NA)
Description
This
test
sets
the
4395A
to
the
p o
w
er
sw
eep
mo
de
and
then
makes
a
p o
w
er
sw
eep
from
050
dBm
to
030
dBm
and
05
dBm
to
15
dBm
in
5
dB
steps.
Using
a
p o
w
er
meter
and
a
high
sensitivity
p o
w
er
sensor,
the
actual
p o
w
er
of
the
4395A
RF
OUT
signal
at
eac
h
sw
eep
p oint
is
measured.
Then
the
p o
w
er
sw
eep
linearit
y
for
a
sw
eep
span
+20
dB
is
calculated.
The
p o
w
er
linearity
is
sp ecied
as
v
alues
relativ e
to
the
stop
p o
w
er.
This
test
uses
a
step
attenuator
to
maintain
the
p o
w
er
sensor
input
lev
el
035
dBm.
This
reduces
the
measuremen
t
uncertain
t
y
caused
b
y
the
p o
w
er
sensor's
linearity
error.
The
actual
p o
w
er
of
the
RF
OUT
signal
is
calculated
b
y
adding
the
attenuation
used
and
the
p o
w
er
meter
reading.
Specification
Sw
eep
range
:
:
:
:
:
:
:
:
:
:
:
:
:
:
:
:
:
:
:
:
:
:
:
:
:
:
:
:
:
:
:
:
:
:
:
:
:
:
:
:
:
:
:
:
:
:
:
:
:
:
:
:
:
:
:
:
:
:
:
:
:
:
:
:
:
:
:
:
:
:
:
20
dB
Sw
eep
linearity
@23 65
C,
50
MHz,
relativ e
to
stop
p o
w
er
:
:
:
:
:
:
:
:
:
:
:
:
:
:
:
:
:
:
:
:
:
:
:
:
:
:
:
:
:
:
:
:
:
:
:
:
:
:
60.5
dB
T
est
Equipment
P
o
w
er
Meter
:
:
:
:
:
:
:
:
:
:
:
:
:
:
:
:
:
:
:
:
:
:
:
:
:
:
:
:
:
:
:
:
:
:
:
:
:
:
:
:
:
:
:
:
:
:
:
436A
Opt.
022,
437B,
or
438A
P
o
w
er
Sensor
:
:
:
:
:
:
:
:
:
:
:
:
:
:
:
:
:
:
:
:
:
:
:
:
:
:
:
:
:
:
:
:
:
:
:
:
:
:
:
:
:
:
:
:
:
:
:
:
:
:
:
:
:
:
:
:
:
:
:
:
:
:
:
:
:
:
:
:
:
:
:
8481D
Step
A
tten
uator,
10
dB
Step
,
VSWR
1.02
:
:
:
:
:
:
:
:
:
:
:
:
:
:
:
:
:
:
:
:
:
8496G
Opt.
001
and
H60
A
tten
uator
driv
er
:
:
:
:
:
:
:
:
:
:
:
:
:
:
:
:
:
:
:
:
:
:
:
:
:
:
:
:
:
:
:
:
:
:
:
:
:
:
:
:
:
:
:
:
:
:
:
:
:
:
:
:
:
:
:
:
:
:
:
:
:
:
:
:
:
:
11713A
T
yp e-N
Cable,
61
cm
:
:
:
:
:
:
:
:
:
:
:
:
:
:
:
:
:
:
:
:
:
:
:
:
:
:
:
:
:
:
:
:
:
:
:
:
:
:
:
:
:
:
:
:
11500B
or
part
of
11851B
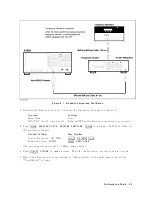
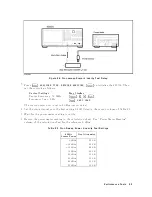
Procedure
1.
Connect
the
p o
w
er
sensor
to
the
p o
w
er
meter.
Then
calibrate
the
p o
w
er
meter
for
the
p o
w
er
sensor.
2.
Set
the
step
attenuator
to
30
dB
b efore
connecting
the
test
equipmen
t.
This
protects
the
p o
w
er
sensor
from
excess
input.
3.
Connect
the
test
equipmen
t
as
sho
wn
in
Figure
2-5 .
P
erformance
T
ests
2-11
Содержание 4395A
Страница 10: ......
Страница 26: ......
Страница 34: ......
Страница 77: ...Figure 2 17 B R Magnitude Ratio Phase Dynamic Accuracy Test Setup 2 Performance Tests 2 43 ...
Страница 167: ...Figure 5 1 Adjustment Hardware Setup Adjustments 5 5 ...
Страница 186: ...Figure 5 13 Receiver Gain Adjustment Location 5 24 Adjustments ...
Страница 190: ...Figure 5 16 Receiver Flatness Adjustment Setup 1 MHz 5 28 Adjustments ...
Страница 194: ...Figure 5 20 DC Bias Adjustment Setup 2 5 32 Adjustments ...
Страница 196: ...Figure 6 1 Troubleshooting Organization 6 2 Troubleshooting ...
Страница 206: ...Figure 7 1 Power Supply Lines Simplified Block Diagram 7 2 Power Supply Troubleshooting ...
Страница 212: ...Figure 7 5 A1 CPU Connector Locations 7 8 Power Supply Troubleshooting ...
Страница 220: ...Figure 8 1 Digital Control Group Simplified Block Diagram 8 2 Digital Control Troubleshooting ...
Страница 240: ...Figure 10 1 Top View Major Assemblies 10 4 Replaceable Parts ...
Страница 292: ...Table A 2 Manual Changes by Firmware Version Version Make Manual Changes A 2 Manual Changes ...
Страница 303: ...Change 6 Change the Replaceable Parts as following Figure A 10 Top View Major Assemblies Manual Changes A 13 ...
Страница 308: ......
Страница 311: ...Figure B 1 Power Cable Supplied Power Requirement B 3 ...
Страница 312: ......
Страница 342: ......


