


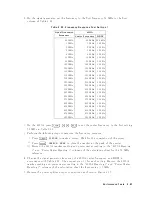


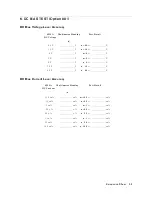

T
able
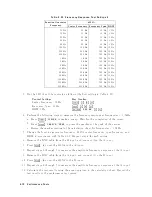
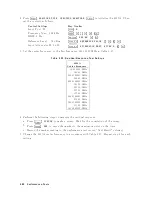
2-23.
Frequency
Response
T
est
Settings
2
F
unction
Generator
F
requency
4395A
Cen
ter
F
requency
F
requency
Span
RBW
10
Hz
10
Hz
15
Hz
1
Hz
15
Hz
15
Hz
15
Hz
1
Hz
25
Hz
25
Hz
15
Hz
1
Hz
40
Hz
40
Hz
15
Hz
1
Hz
80
Hz
80
Hz
15
Hz
1
Hz
100
Hz
100
Hz
150
Hz
10
Hz
200
Hz
200
Hz
150
Hz
10
Hz
500
Hz
500
Hz
150
Hz
10
Hz
1
kHz
1
kHz
150
Hz
10
Hz
2
kHz
2
kHz
150
Hz
10
Hz
5
kHz
5
kHz
150
Hz
10
Hz
10
kHz
10
kHz
150
Hz
10
Hz
20
kHz
20
kHz
150
Hz
10
Hz
50
kHz
50
kHz
150
Hz
10
Hz
100
kHz
100
kHz
150
Hz
10
Hz
200
kHz
200
kHz
150
Hz
10
Hz
500
kHz
500
kHz
150
Hz
10
Hz
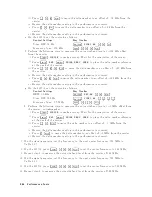
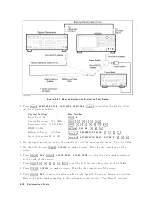
3.
On
the
4395A,
set
the
con
trols
as
follo ws
(the
rst
setting
in
T
able
2-23 ):
Con
trol
Settings
Key
Strok
es
Cen
ter
F
requency:
10
Hz
4
Center
5,
4
1
5,
4
0
5,
4
x1
5
F
requency
Span:
10
Hz
4
Span
5,
4
1
5,
4
0
5,
4
x1
5
RBW:
1
Hz
4
Bw/Avg
5,
NNNNNNNNNNNNNNNNNNNN
RES
BW
,
4
1
5,
4
x1
5
4.
P
erform
the
following
steps
to
measure
the
frequency
resp onse
at
frequencies
<
1
MHz.
a.
Press
4
T
rigger
5,
NNNNNNNNNNNNNNNNNNNN
SINGLE
to
make
a
sw
eep.
W
ait
for
the
completion
of
the
sw
eep.
b.
Press
4
Search
5,
NNNNNNNNNNNNNNNNNNNNNNNNNNNNNNNNNNNNNN
SEARCH:
PEAK
to
place
the
marker
at
the
p eak
of
the
carrier.
c.
Record
the
marker
reading
in
the
calculation
sheet
for
frequencies
<
1
MHz.
5.
Change
the
function
generator
frequency
,
4395A
cen
ter
frequency
,
span
frequency
and
RBW
in
accordance
with
T
able
2-23.
Repeat
step
4
for
eac
h
setting:
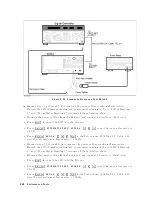
6.
Remo
v
e
the
BNC
cable
from
the
R
input,
and
connect
it
to
the
A
input.
7.
Press
4
Meas
5,
NNNNN
A
to
set
the
4395A
to
the
A
input.
8.
Rep
eat
steps
4
through
5
to
measure
the
amplitude
frequency
resp onse
at
the
A
input.
9.
Remo
v
e
the
BNC
cable
from
the
A
input,
and
connect
it
to
the
B
input.
10.
Press
4
Meas
5,
NNNNN
B
to
set
the
4395A
to
the
B
input.
11.
Rep
eat
steps
4
through
5
to
measure
the
amplitude
frequency
resp onse
at
the
A
input.
12.
Calculate
the
test
results
using
the
equation
given
in
the
calculation
sheet.
Record
the
test
results
in
the
p erformance
test
record.
2-70
P
erformance
T
ests
Содержание 4395A
Страница 10: ......
Страница 26: ......
Страница 34: ......
Страница 77: ...Figure 2 17 B R Magnitude Ratio Phase Dynamic Accuracy Test Setup 2 Performance Tests 2 43 ...
Страница 167: ...Figure 5 1 Adjustment Hardware Setup Adjustments 5 5 ...
Страница 186: ...Figure 5 13 Receiver Gain Adjustment Location 5 24 Adjustments ...
Страница 190: ...Figure 5 16 Receiver Flatness Adjustment Setup 1 MHz 5 28 Adjustments ...
Страница 194: ...Figure 5 20 DC Bias Adjustment Setup 2 5 32 Adjustments ...
Страница 196: ...Figure 6 1 Troubleshooting Organization 6 2 Troubleshooting ...
Страница 206: ...Figure 7 1 Power Supply Lines Simplified Block Diagram 7 2 Power Supply Troubleshooting ...
Страница 212: ...Figure 7 5 A1 CPU Connector Locations 7 8 Power Supply Troubleshooting ...
Страница 220: ...Figure 8 1 Digital Control Group Simplified Block Diagram 8 2 Digital Control Troubleshooting ...
Страница 240: ...Figure 10 1 Top View Major Assemblies 10 4 Replaceable Parts ...
Страница 292: ...Table A 2 Manual Changes by Firmware Version Version Make Manual Changes A 2 Manual Changes ...
Страница 303: ...Change 6 Change the Replaceable Parts as following Figure A 10 Top View Major Assemblies Manual Changes A 13 ...
Страница 308: ......
Страница 311: ...Figure B 1 Power Cable Supplied Power Requirement B 3 ...
Страница 312: ......
Страница 342: ......


