58
000000Ć1150Ć839 IOLMaster 11.02.2004
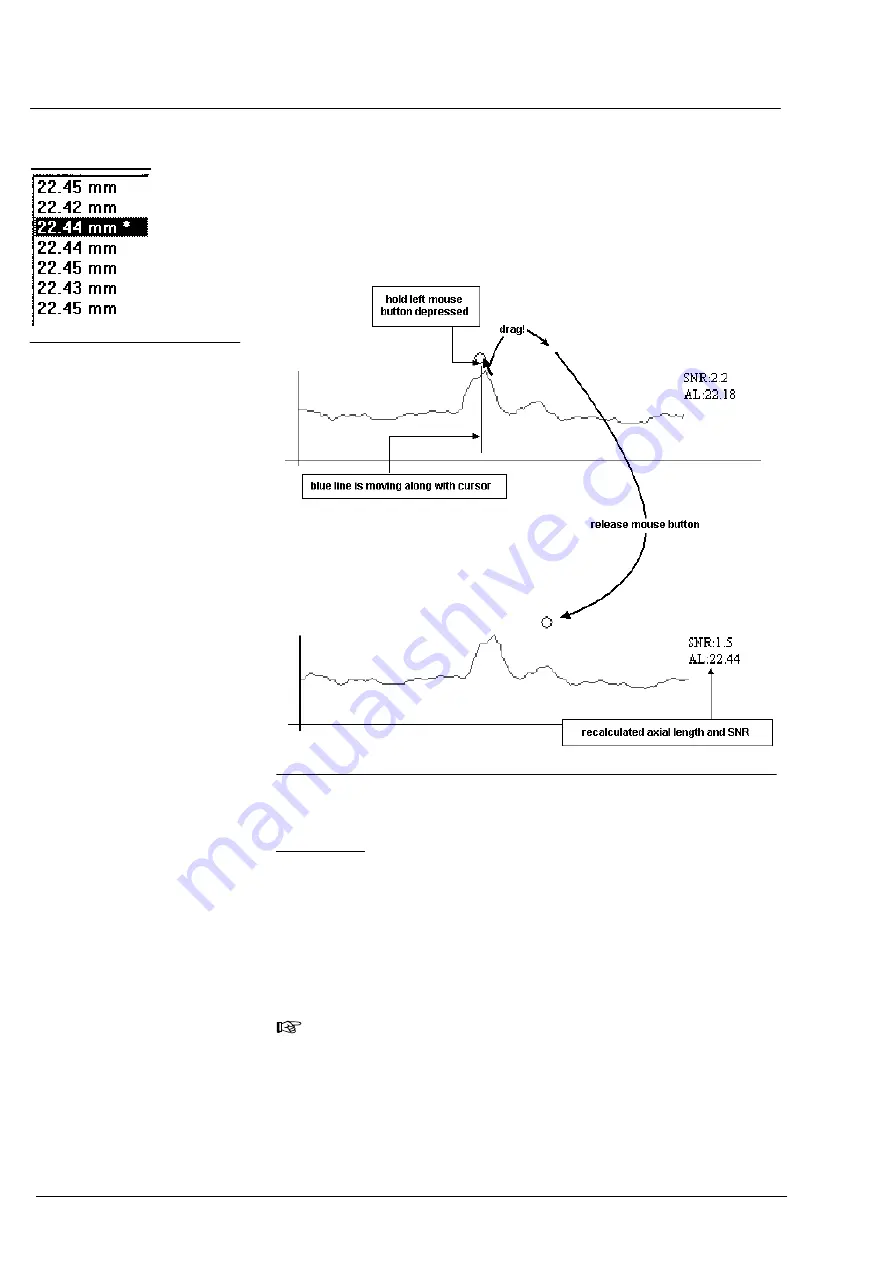
Then, the display will show the corresponding axial length value and the
corresponding SNR, which will always be smaller than the maximal SNR
found automatically. This recalculated measured value will appear in the
display field denoted by an asterisk (*) (Fig. 46).
Example:
Fig. 47 Moving the measuring cursor to a different peak (signal curve zoomed
in3Ćtimes)
Explanation:
This manipulation will work only if the measuring cursor is moved fully
across the (local) maximum of the desired target peak. This procedure
is necessary for the search algorithm to reliably find the desired peak
without returning and snapping in to the original (higher) peak.
Closely adjacent peaks (double peaks) cannot be separated by this
automatic method unless the curve adjoining them drops down below
a value which is less than half the amplitude of their maxima.
Note:
While dragging the measuring cursor, the original axial length
value and SNR remain displayed beside the signal curve. The new
axial length value and the corresponding SNR will be calculated
and displayed only when you release the mouse button.
Fig. 46 Value denoting
manipulation
Evaluation of ALM results


