


MOTOROLA CMOS LOGIC DATA
CHAPTER 7
7–2
RELIABILITY
Paramount in the mind of every semiconductor user is the
question of device performance versus time. After the
applicability of a particular device has been established, its
effectiveness depends on the length of troublefree service it
can offer. The reliability of a device is exactly that — an
expression of how well it will serve the customer. The
following discussion will attempt to present an overview of
Motorola’s reliability efforts.
BASIC CONCEPTS
It is essential to begin with an explanation of the various
parameters of Reliability. These are probably summarized
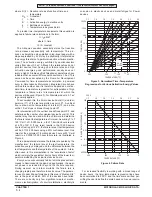
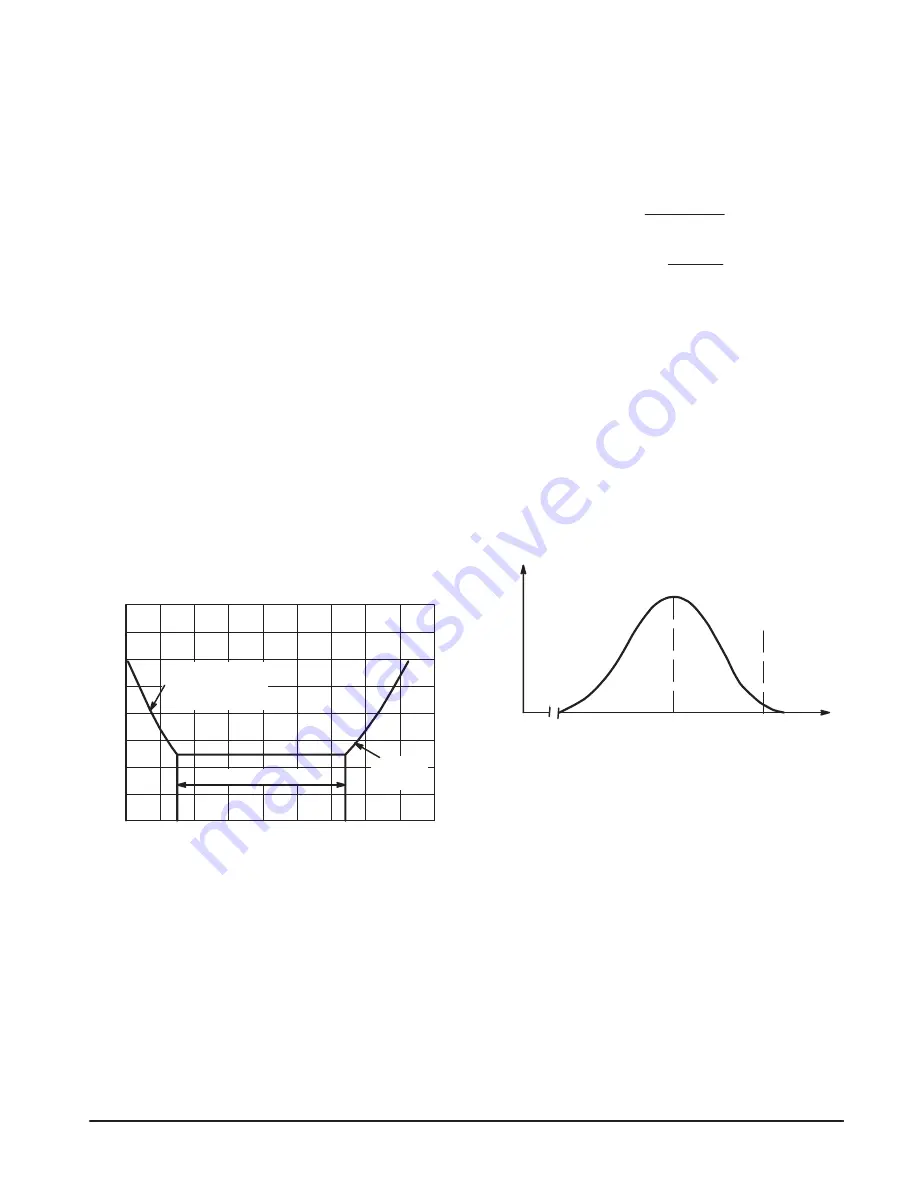
best in the Bathtub Curve (Figure 1). The reliability perfor-
mance of a device is characterized by three phases: infant
mortality, useful life, and wearout. When a device is
produced, there is often a small distribution of failure
mechanisms which will exhibit themselves under relatively
moderate stress levels and therefore appear early. This
period of early failures, termed infant mortality is reduced
significantly through proper manufacturing controls and
screening techniques. The most effective period is that in
which only occasional random failure mechanisms appear.
The useful life typically spans a long period of time with a
very low failure rate. The final period is that in which the
devices literally wear out due to continuous phenomena
which existed at the time of manufacture. Using strictly
controlled design techniques and selectivity in applications,
this period is shifted well beyond the lifetime required by the
user.
Figure 1.
TIME (HOURS)
FAILURE RA
TE
INFANT MORTALITY
(SUCH AS EARLY
BURN–IN FAILURES)
WEAROUT
FAILURES
USEFUL LIFE
1,000,000
100,000
10,000
1000
100
10
Both the infant mortality and random failure rate regions
can be described through the same types of calculations.
During this time the probability of having no failures to a
specific point in time can be expressed by the equation:
Po = e–
λ
t
where
λ
is the failure rate and t is time. Since
λ
is changing
rapidly during infant mortality, the expression does not
become useful until the random period, where
λ
is relatively
constant. In this equation
λ
is failures per unit of time. It is
usually expressed in percent failures per thousand hours.
Other forms include FIT (Failures in Time = (%/103 hrs) x
10–4 = 10–9 failures per hour) and MTTF (Mean Time To
Failure) or MTBF (Mean Time Between Failures), both being
equal to 1/
λ
and having units of hours.
Since reliability evaluations usually involve only samples
of an entire population of devices, the concepts of the Cen-
tral Limit Theorem apply and
λ
is calculated using x2 distribu-
tion through the equation:
x2 (x, 2r + 2)
2nt
λ
v
100 – CL
where x =
100
CL = Confidence Limit in percent
r = Number of rejects
n = Number of devices
t = Duration of test
The confidence limit is the degree of conservatism desired
in the calculation. The Central Limit Theorem states that the
values of any sample of units out of a large population will
produce a normal distribution. A 50% confidence limit is
termed the best estimate and is the mean of this distribution.
A 90% confidence limit is a very conservative value and
results in a higher
λ
which represents the point at which 90%
of the area of the distribution is to the left of that value
(Figure 2). The term (2r + 2) is called the degrees of freedom
and is an expression of the number of rejects in a form
suitable to x2 tables.
Figure 2.
50% CL
FREQUENCY
90% CL
λ
, FAILURE RATE
The number of rejects is a critical factor since the definition
of rejects often differs between manufacturers. While
Motorola uses data sheet limits to determine failures, some-
times rejects are counted only if they are catastrophic. Due to
the increasing chance of a test not being representative of
the entire population, as sample size and test time are de-
creased, the x2 calculation produces surprisingly high values
of
λ
for short test durations even though the true long term
failure rate may be quite low. For this reason relatively large
amounts of data must be gathered to demonstrate the real
long term failure rate.
Since this would require years of testing on thousands of
devices, methods of accelerated testing have been devel-
oped.
Years of semiconductor device testing has shown that
temperature will accelerate failures and that this behavior fits
the form of the Arrhenius equation:
R (t) = R0(t)e –
θ
/kT
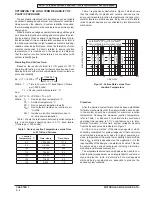
Summary of Contents for CMOS Logic
Page 1: ......
Page 5: ...iv MOTOROLA CMOS LOGIC DATA ...
Page 6: ...Master Index 1 ...
Page 12: ...Product Selection Guide 2 ...
Page 17: ...The Better Program 3 ...
Page 20: ...B and UB Series Family Data 4 ...
Page 25: ...CMOS Handling and Design Guidelines 5 ...
Page 32: ...CMOS Handling and Design Guidelines 5 ...
Page 39: ...Data Sheets 6 ...
Page 234: ...MOTOROLA CMOS LOGIC DATA MC14174B 6 196 FUNCTIONAL BLOCK DIAGRAM TIMING DIAGRAM ...
Page 238: ...MOTOROLA CMOS LOGIC DATA MC14175B 6 200 FUNCTIONAL BLOCK DIAGRAM TIMING DIAGRAM ...
Page 555: ...CMOS Reliability 7 ...
Page 561: ...Equivalent Gate Count 8 ...
Page 563: ...Packaging Information Including Surface Mounts 9 ...
Page 571: ......