M6500 Series NE Configuration Manual
178
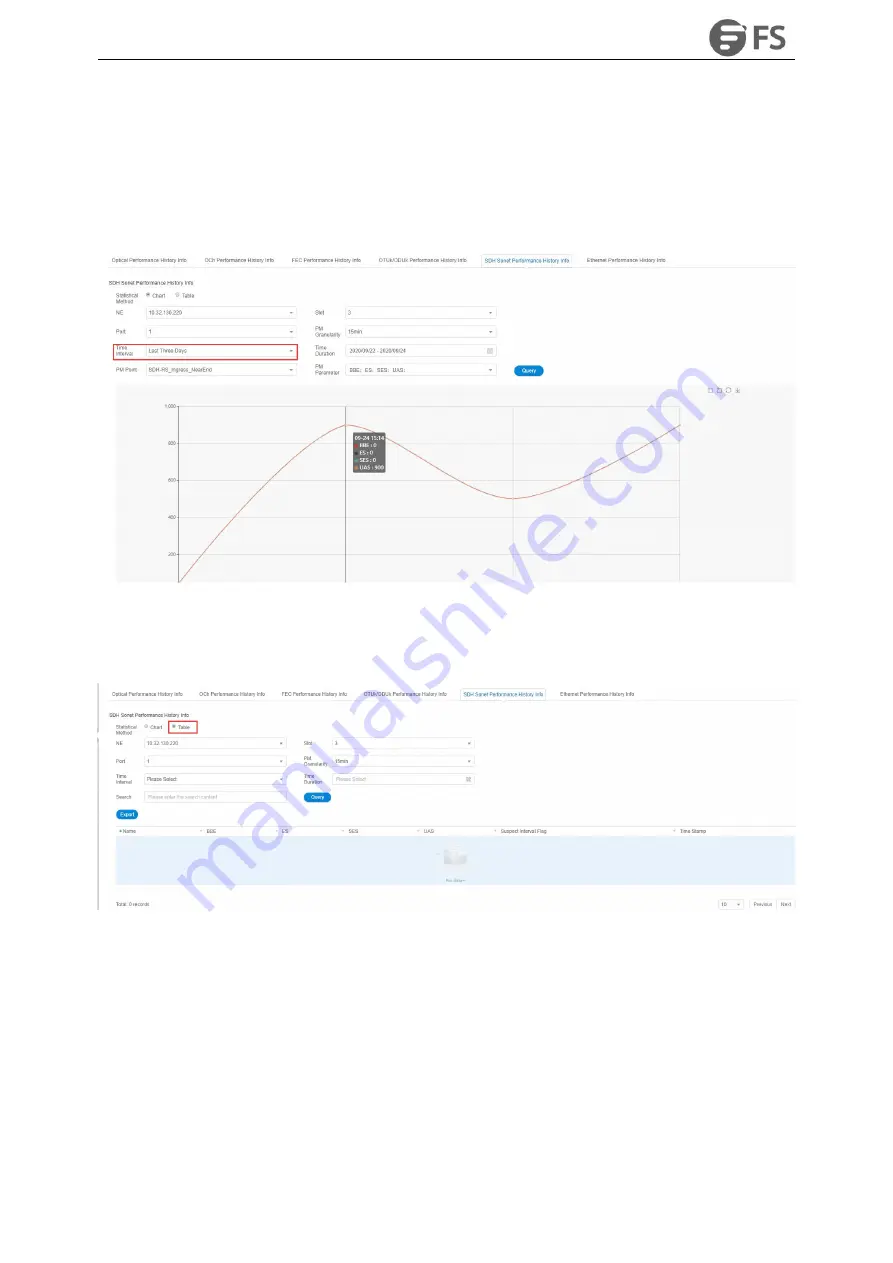
and then select the time interval, performance monitoring point and parameters which need to be monitored
in the right menu.Parameters to be monitored can be all selected or only select one or two of them to
check.After that, click Apply button on the lower right corner. From the graph, we can see the trend of the
refraction chart of the monitoring parameters. The ordinate represents the value of the monitoring data, and
the abscissa represents the time. Data which has been read for more than 15 minutes will be automatically
transferred from current statistics to history statistics.
Figure9-87 15-Minute Chart Data of SDH Regeneration Segment
History performance statistics of SDH regeneration segment also show history data in tabular form. Click on the
table, the interface as shown in the figure below appears:
Figure9-88 15-Minute Tabular Interface of SDH Regeneration Segment
Click the time interval shortcut in the right menu or select the required time interval in Duration, and then click
on Apply button in the lower right corner, the history data of all SDH regeneration segment monitoring points
on this port will be displayed, as shown in the figure below:
Summary of Contents for M6500 Series
Page 12: ...M6500 Series NE Configuration Manual 11 Figure 1 3 Start NMS Server...
Page 109: ...M6500 Series NE Configuration Manual 108 Figure6 5 TP Multiplexing Configuration Step 2...
Page 113: ...M6500 Series NE Configuration Manual 112 Figure6 12 Set Line Side PM Overhead...
Page 116: ...M6500 Series NE Configuration Manual 115 Figure6 16 Configure Line Side Port TTI...
Page 117: ...M6500 Series NE Configuration Manual 116 Figure6 17 Configure Client Side Local End Port TTI...
Page 129: ...M6500 Series NE Configuration Manual 128 Figure7 10 Select Protection Mode...


