


Manual Energy Storage Inverter ESI-S
The ESI-Manager user interface 97
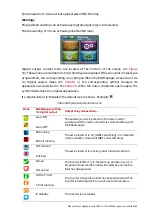
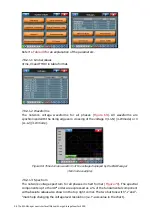
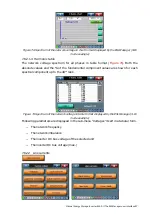
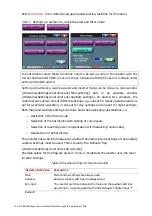
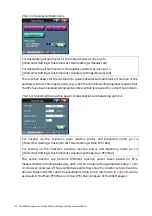
Figure 70: Spectrum of the network voltage in chart format displayed by the ESI-Manager (4-W
mode example)
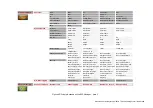
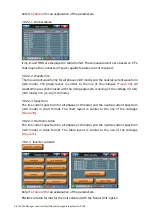
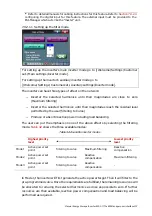
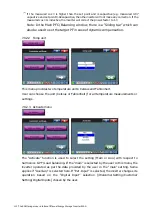
7.8.2.1.4 Harmonic table
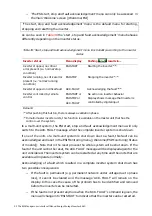
The network voltage spectrum for all phases in table format (
). Both the
absolute values and the % of the fundamental component values are shown for each
spectral component up to the 49
th
rank.
Figure 71: Spectrum of the network voltage in table format displayed by the ESI-Manager (4-W
mode example)
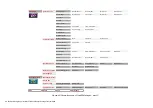
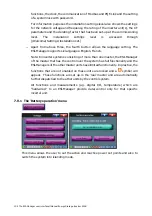
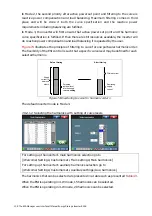
Following parameters are displayed in the sub-menu “Voltages” itself in a tabular form.
−
The network frequency
−
The network imbalance
−
The inverter DC bus voltage of the selected unit
−
The inverter DC bus voltage (max.)
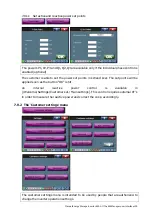
7.8.2.2 Line currents