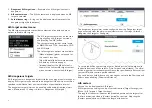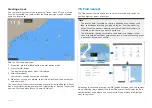
5.
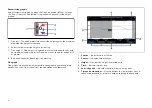
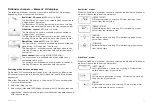
Direction
— Indicates the direction of the current (relative to North).
6.
Time and date options
— Use the buttons to view previous, next or
today’s tide predictions, or enter a date by selecting the date field.
7.
Ebb / Flood
— Displays a list showing ebb, slack and flood tides.
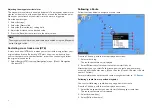
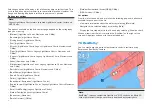
Displaying tide or current graphs
1. Select a tide or current station symbol or dynamic graphic.
2. Select
[more options]
from the context menu.
3. Select
[Tide station]
or
[Current station]
Note:
You can also access tide and current graphs by selecting
[More info]
from
the pop-over options when performing a
[Find nearest]
search for tides.
7.9 Chart settings menu
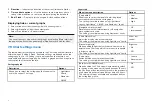
The table below lists settings applicable to the Chart app and their location
within the app’s
[Settings]
menu. Available settings are dependent on the
cartography in use. If a setting is not displayed then the feature is not
compatible with your cartography. If a feature is grayed out then it requires a
subscription to activate the feature.
Cartography tab
Description
Options
Allows you to select the cartography that you want to
use in the current Chart app.
•
LightHouse
Charts
•
Navionics
•
C-MAP
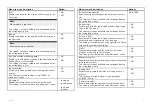
Layers tab
Menu item and description
Options
[Chart detail:]
Allows you to select the level of detail displayed
onscreen for vector based cartography.
This setting is available when using LightHouse™,
Legacy LightHouse™, C-MAP® and Navionics® charts.
•
Low
•
Medium
•
High
[Navigation mark symbols]
Determines whether International or US navigation
mark symbols are used
This setting is available when using Navionics® charts.
•
US
•
International
[Chart Object Size]
Adjust the display size of chart objects.
This setting is available when using LightHouse™ charts.
Slider bar
control.
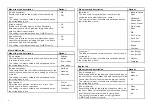
[Day color palette]
When enabled
[Bright sun]
switches to a darker color
palette in the Chart app which is more easily readable
in bright sunlight.
This setting is available when using LightHouse™ charts.
Bright sun:
•
On
•
Off
[Chart style]
Switch between chart presentation styles.
This setting is available when using LightHouse™ charts.
•
Leisure
•
Government
[Auto enter RUNNING mode:]
When enabled the Chart app will automatically switch
to running mode when vessel speed exceeds 10 knots,
the Chart app will automatically switch to the previously
used mode when vessel speed drops below 10 knots.
This setting is always available and not dependent on
the cartography in use.
•
On
•
Off
86

