


Section 2: General operation
Model 2461 Interactive SourceMeter® Instrument Reference Manual
2-32
2461-901-01 A/November 2015
Views Graph menu
The
Graph
menu opens a screen that displays a graph of the measurements in selected
reading buffers as traces. It also contains tabs that you use to customize the graph display.
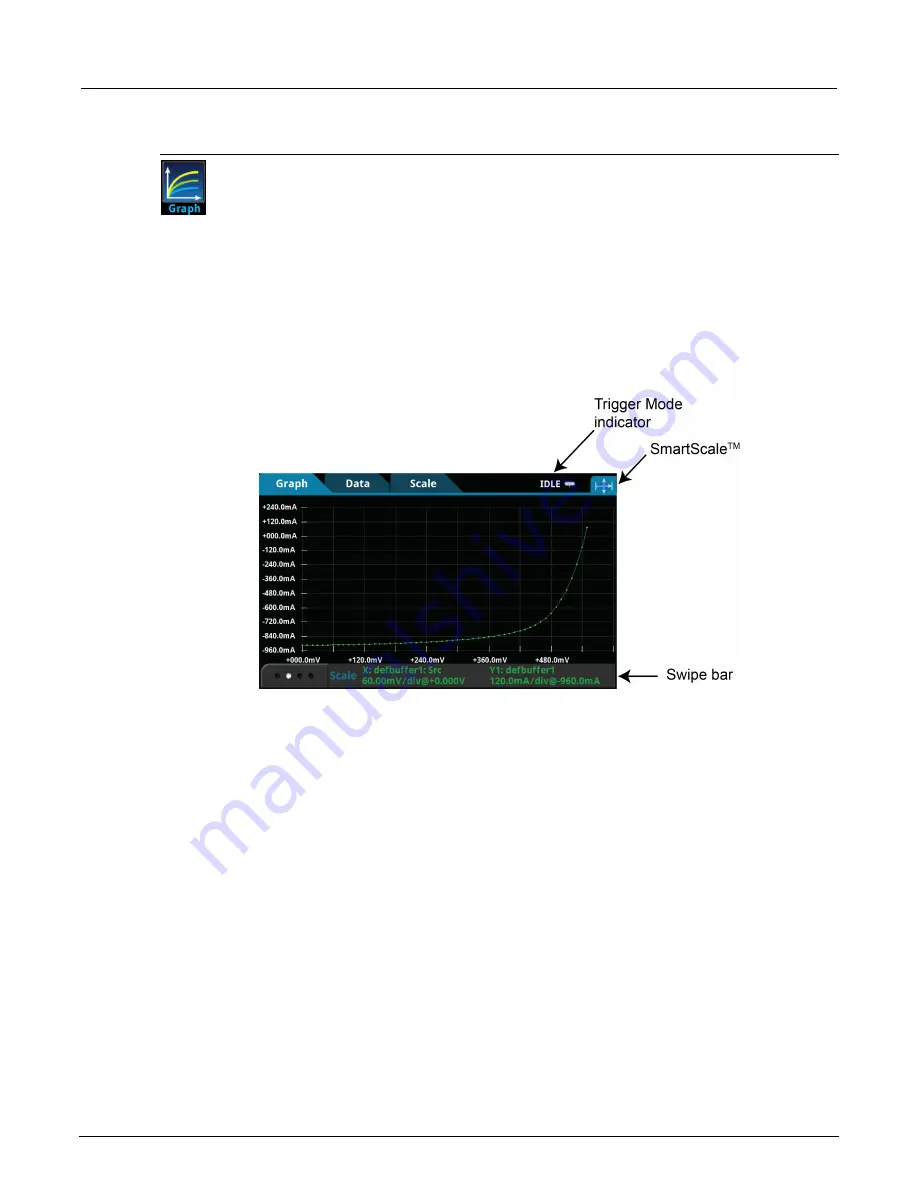
You can also select the trigger mode and initiate the trigger model from this screen. Select
the trigger mode indicator in the upper right corner of the screen and select the trigger
mode. Refer to Trigger mode indicator for details.
Graph tab
The Graph tab graphs readings as they are made by the instrument. Settings you make on the Data,
Scale, and Trigger tabs affect how readings appear on this screen. You can also select the number of
traces that are displayed.
Figure 23: Graph tab
You can zoom in or out in the graph view by placing two fingers on the screen and moving them
together or apart in a pinching motion. You can also move the view of the graph to the left or right by
placing a finger on the screen and moving it in either direction. If you want to set the method of
scaling data to SmartScale
TM
, select the icon in the upper-right corner of the Graph tab. The
instrument determines the best way to scale data based on the data and the instrument configuration
(such as the measure count).
You can set the X and Y axes to show different values appropriate for your application. The bottom of
the Graph tab contains a legend of the active axis and scale settings for the graph.