6
Monitoring the DR Series System
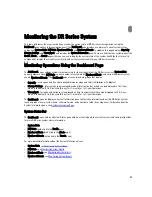
This topic introduces the ways in which you monitor the current state of DR Series system operations using the
Dashboard page options in the navigation panel. The Dashboard page displays a summary of current system status
categories (System State, HW State, Number of Alerts, and Number of Events. In addition, this page displays Capacity,
Storage Savings, and Throughput), and includes the System Information pane. There are links to other system pages (the
Health, Alerts, and Events pages) that you can use to display the current state of the system health (by the status of its
components), display the current system alerts, and current system events for your DR Series system.
Monitoring Operations Using the Dashboard Page
The Dashboard page contains system status indicators for the current state of the DR Series system (System State),
current hardware state (HW State), current number of system alerts (Number of Alerts), and current number of system
events (Number of Events). The Dashboard page also contains data graphs that display:
•
Capacity—used space and free space available in percentage and total (in Gibibytes or Tebibytes)
•
Storage Savings—total savings in percentage based on time (in minutes), which can be displayed in 1h (1–hour,
which is the default), 1d (1–day), 5d (5–day), 1m (1–month), or 1y (1–year) durations.
•
Throughput—for reads and writes in volume based on time (in minutes), which can be displayed in 1h (1–hour,
which is the default), 1d (1–day), 5d (5–day), 1m (1–month), or 1y (1–year) durations.
The Dashboard page also displays a System Information pane that lists key information about this DR Series system
(such as product name, system name, software version, and a number of other key categories). For details about the
System Information pane, see
System Information Pane
.
System Status Bar
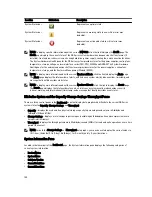
The Dashboard page contains a System Status pane with icons that indicate the current system status and provide links
for more DR Series system status information:
•
System State
•
HW State (with a link to the Health page)
•
Number of Alerts (with a link to the Alerts page)
•
Number of Events (with a link to the Events page)
For more detailed information about the System Status pane icons:
•
System State, see
Monitoring System Usage
.
•
HW State, see
Monitoring System Health
.
•
Number of Alerts, see
Monitoring System Alerts
.
•
Number of Events, see
Monitoring System Events
.
99
Содержание DR series
Страница 1: ...Dell DR Series System Administrator Guide ...
Страница 10: ...10 ...
Страница 34: ...34 ...
Страница 138: ...138 ...
Страница 160: ...160 ...

