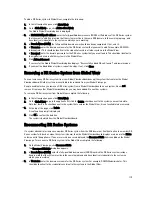
To filter the system events you want to display in the Events summary table, complete the following:
1.
Click Dashboard
→
Events (or access the Events page via the Number of Events link).
The Events page is displayed, which lists the number of current events and the current time zone set for the system.
2.
In the Event Filter pane, select the desired severity to display from the Event Severity drop-down list.
System event severity levels include:
– All—displays all four types of system events (All, Critical, Warning, and Info)
– Critical—displays only critical events (in red)
– Warning—displays only warning events (in yellow)
– Info—displays only informational events
3.
In Message Contains, enter a word or string of words that you want to search for in the Message text field, and the
DR Series system will perform a case-insensitive match for your entry (no other search options are supported).
Matches are displayed in the Events summary table.
4.
Click the Calendar icon (adjacent to Timestamp From) to configure a start setpoint.
To configure a start setpoint, complete the following:
– Select the desired day in the current month, or click the left or right arrow in the month title bar to select a
previous or later month.
– Adjust the Hour and Minute sliders to the desired time (or click Now to set the date and time as the current date
and time in hours and minutes).
– Click Done.
5.
Click the Calendar icon (adjacent to Timestamp To) to configure an end setpoint.
To configure an end setpoint, complete the following:
– Select the desired day in the current month, or click the left or right arrow in the month title bar to select a
previous or later month.
– Adjust the Hour and Minute sliders to the desired time (or click Now to set the date and time to be the current
date and time in hours and minutes).
– Click Done.
6.
Click Start Filter (or click Reset to return all values to default values).
The search results based on your filter choices are displayed in the Events summary table.
For more information about using the Events summary table, see
Using the Dashboard to Display System Events
.
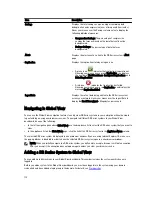
Monitoring System Health
Monitor and display the current state of your system hardware status using the following methods in the DR Series
system:
•
Using Dashboard
→
Health , you can access the Health page from the navigation panel.
•
In the Dashboard page, you can access the Health page via the HW State link.
For more information about the Health page, see
Health
.
104
Содержание DR series
Страница 1: ...Dell DR Series System Administrator Guide ...
Страница 10: ...10 ...
Страница 34: ...34 ...
Страница 138: ...138 ...
Страница 160: ...160 ...

