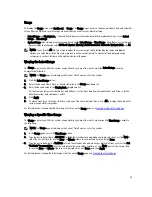

System Usage
This Usage page is where the DR Series system usage is displayed based on the Latest Time or Time Range values you
selected. System usage statistics are grouped and represented by the following tabs:
•
CPU Load
•
System
•
Memory
•
Active Processes
•
Protocols
•
Network
•
Disk
•
All
NOTE: If you click All, it displays system usage defined by the range and display options you select, and the file
system protocols you have configured. To view all of the displayed usage categories, use the scroll bar on the
right-hand side of the page.
The All tab displays the entire set of system status categories in graphical format (depending upon your file system
protocol type).
For more information, see
Monitoring System Usage
.
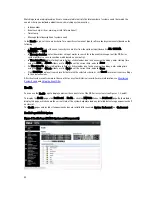
Container Statistics
To display the Container Statistics page, click Dashboard
→
Container Statistics. This page lets you select from the
Container Name drop-down list, and based on the container you select, displays a variety of statistics for the specified
container:
NOTE: The DR Series system polls for statistics every 30 seconds.
•
Backup Data pane: Displays the current number of active files ingested (based on time/minutes) and the current
number of active bytes (mebibytes/MiB) ingested based on time in minutes. You can choose to click Zoom to view
the backup data active files and active bytes statistics in other than the default mode of 1h (1–hour). The other
selectable viewing options are 1d (1–day), 5d (5–day), 1m (1–month), and 1y (1–year).
•
Throughput pane: Displays the current number of Mebibytes/second (MiB/s) for read operations (based time/
minutes) and the current number of MiB/s for write operations (based on time/minutes). You can choose to click
Zoom to view the throughput statistics in other than the default mode of 1h (1–hour). The other viewing options are
1d (1–day), 5d (5–day), 1m (1–month), and 1y (1–year) that you can select.
NOTE: To refresh the values listed in the Backup Data and Throughput panes, click
.
•
Marker Type and Connection Type pane: Displays the marker type associated with the selected container (for
example, Auto, Networker, or another), and the Connection Type (NFS/CIFS, OST, or RDS).
•
If the selected container includes an NFS connection type, there will be an NFS Connection Configuration pane.
•
If the selected container includes a CIFS connection type, there will be a CIFS Connection Configuration pane.
•
If the selected container includes an OST or RDS connection type, the OST or RDS login entry user is listed (for
example, backup_user) with the following tabs: Capacity, Duplication, and Client Statistics.
•
(Optional) Replication pane: Displays the Replication Configuration and Replication Status panes. The Replication
pane is only displayed in the Container Statistics page if the selected container is configured for replication.
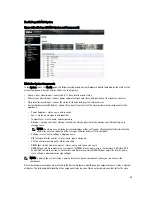
Backup Data Pane
The Backup Data pane in the Container Statistics page displays the following graphed information:
52
Содержание DR series
Страница 1: ...Dell DR Series System Administrator Guide ...
Страница 10: ...10 ...
Страница 34: ...34 ...
Страница 138: ...138 ...
Страница 160: ...160 ...