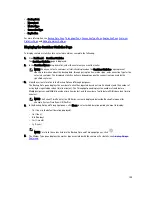
•
Backup Data
•
Throughput
•
Marker Type
•
Connection Type
•
Replication
For more information, see
Backup Data Pane
,
Throughput Pane
,
Connection Type Pane
,
Replication Pane
,
Container
Statistics Page
, and
Editing Container Settings
.
Displaying the Container Statistics Page
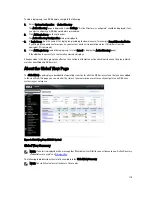
To display container statistics for a selected container, complete the following:
1.
Click Dashboard
→
Container Statistics.
The Container Statistics page is displayed.
2.
In the Container Name: drop-down list, select the container you want to monitor.
NOTE: When you select a container, all statistics displayed on the Container Statistics page represent
specific information about the backup data, throughput, replication, marker type, and connection type for the
selected container. The displayed statistics will vary depending upon the connection type used by the
specified container.
3.
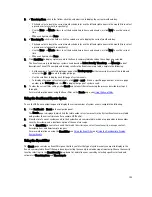
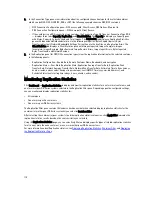
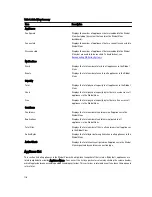
View the current statistics in the Backup Data and Throughput panes.
The Backup Data pane displays the number of active files ingested based on time (in minutes), and the number of
active bytes ingested based on time (in minutes). The Throughput pane displays the number of read data in
Mebibytes/per second (MiB/s) based on time (in minutes), and the number of write data in MiB/s based on time (in
minutes).
NOTE: The Current Time Zone for the DR Series system is displayed below the Backup Data pane (for
example, System Time Zone: US/Pacific).
4.
In the Backup Data and Throughput panes, click Zoom to select which duration period you want to display:
– 1h (1-hour is the default duration displayed)
– 1d (1-day)
– 5-d (five-day)
– 1m (1-month)
– 1y (1-year)
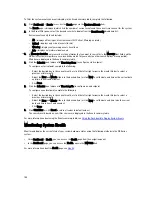
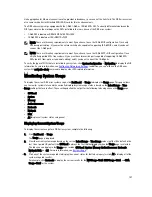
NOTE: To refresh the values listed in the Backup Data and Throughput panes, click
.
5.
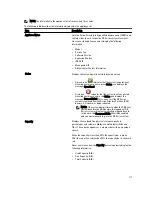
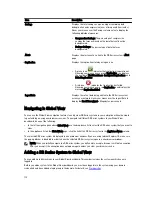
The Marker Type pane displays the marker type associated with the container. For details, see
Creating Storage
Containers
.
109
Содержание DR series
Страница 1: ...Dell DR Series System Administrator Guide ...
Страница 10: ...10 ...
Страница 34: ...34 ...
Страница 138: ...138 ...
Страница 160: ...160 ...

