


Statistics and Data Plots
542
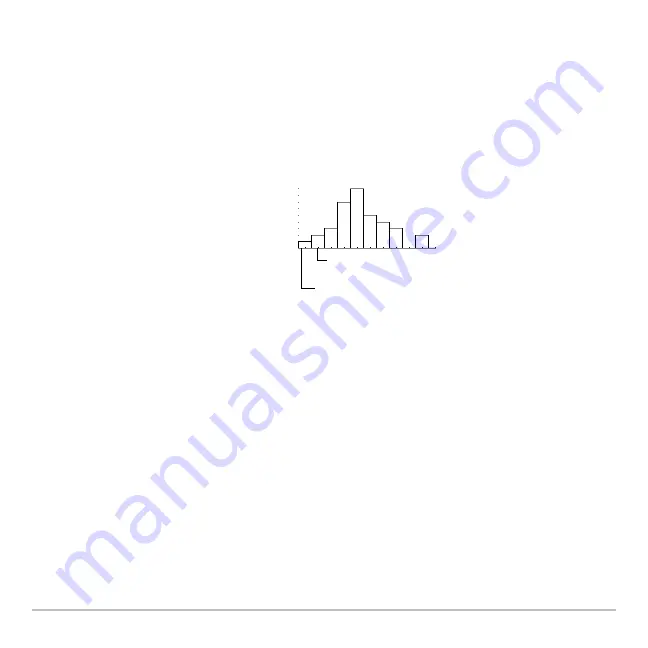
Histogram
This plots one-variable data as a histogram. The x axis is divided into equal widths called
buckets or bars. The height of each bar (its y value) indicates how many data points fall
within the bar’s range.
•
ZoomData
(
„
9
from the Graph screen, Y= Editor, or Window Editor) adjusts
xmin
and
xmax
to include all data points, but it does not adjust the y axis.
-
Use
8
$
to set
ymin = 0
and
ymax
= the number of data points expected
in the tallest bar.
•
When defining the plot,
you can specify the
Hist.
Bucket Width
(default is 1)
to set the width of each
bar.
•
A data point at the edge of
a bar is counted in the bar
to the right.
xmin + Hist. Bucket Width
xmin
Number of bars
xmax – xmin
Hist. Bucket Width
----------------------------------------------
=
Summary of Contents for Titanium TI-89
Page 9: ...Getting Started 6 TI 89 Titanium keys Ë Ì Í Ê ...
Page 34: ...Getting Started 31 2 or D 2 B u s i n e s s D B D B Press Result ...
Page 43: ...Getting Started 40 3 0 D B D D B D Press Result ...
Page 44: ...Getting Started 41 D 2 0 0 2 D B Scroll down to October and press Press Result ...
Page 58: ...Getting Started 55 Example Set split screen mode to TOP BOTTOM Press Result 3 B D ...
Page 70: ...Getting Started 67 ...
Page 175: ...Operating the Calculator 172 From the Keyboard ...
Page 456: ...Tables 453 ...
Page 527: ...Data Matrix Editor 524 ...


