


3D Graphing
369
Note:
You can move the cursor only within the x and y boundaries set by Window
variables
xmin
,
xmax
,
ymin
, and
ymax
.
Although the rules are straightforward, the actual cursor movement can be confusing
unless you know the orientation of the axes.
Note:
To show the axes and their labels from the Y= Editor, Window Editor, or Graph
screen, use:
8
Í
Simple Example of Moving the Cursor
The following graph shows a sloped plane that has the equation z1(x,y) =
‘M
(x + y) / 2.
Suppose you want to trace around the displayed boundary.
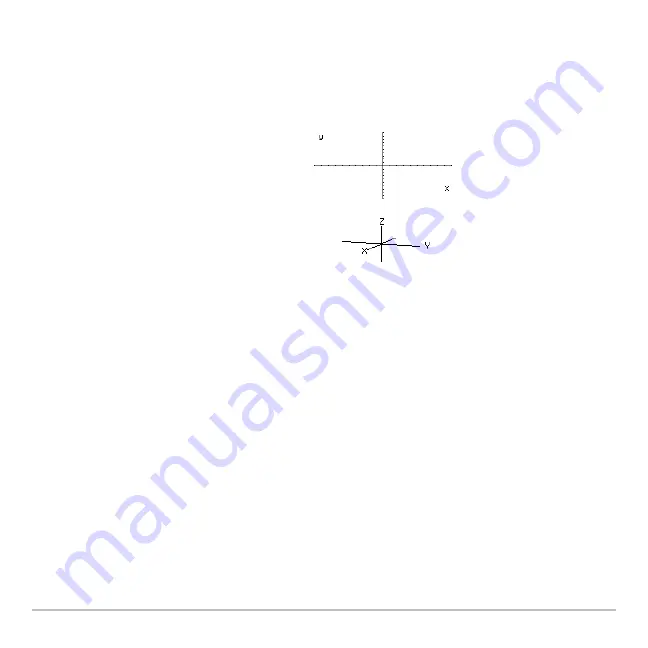
In 2D graphing, the x and y axes always
have the same orientation relative to the
Graph screen.
In 3D graphing, x and y have a different
orientation relative to the Graph screen.
Also, you can rotate and/or elevate the
viewing angle.
eye
q
=20 eye
f
=70 eye
ψ
=0
Summary of Contents for Titanium TI-89
Page 9: ...Getting Started 6 TI 89 Titanium keys Ë Ì Í Ê ...
Page 34: ...Getting Started 31 2 or D 2 B u s i n e s s D B D B Press Result ...
Page 43: ...Getting Started 40 3 0 D B D D B D Press Result ...
Page 44: ...Getting Started 41 D 2 0 0 2 D B Scroll down to October and press Press Result ...
Page 58: ...Getting Started 55 Example Set split screen mode to TOP BOTTOM Press Result 3 B D ...
Page 70: ...Getting Started 67 ...
Page 175: ...Operating the Calculator 172 From the Keyboard ...
Page 456: ...Tables 453 ...
Page 527: ...Data Matrix Editor 524 ...


