


Basic Function Graphing
318
Note:
For Math results, cursor coordinates are stored in system variables xc and yc (rc
and
q
c if you use polar coordinates). Derivatives, integrals, distances, etc., are stored in
the system variable
sysMath
.
Finding y(x) at a Specified Point
1. From the
Graph
screen, press
‡
and select
1:Value
.
2. Type the x value, which must be a real value between
xmin
and
xmax
. The value can
be an expression.
4. Press
D
or
C
to move the cursor between functions at the entered x value. The
corresponding y value is displayed.
If you press
A
or
B
, the free-moving cursor appears. You may not be able to move it
back to the entered x value.
Shade
Depends on the number of functions graphed.
•
If only one function is graphed, this shades the
function’s area above or below the x axis.
•
If two or more functions are graphed, this shades the
area between any two functions within an interval.
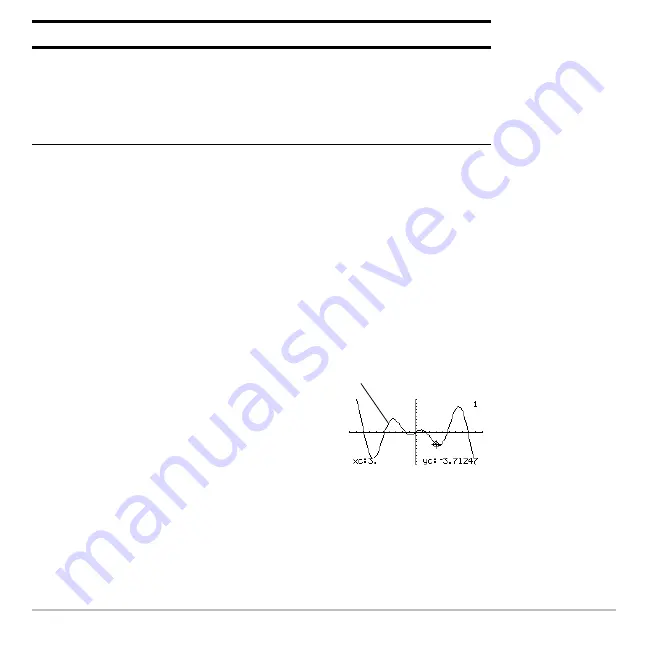
3. Press
¸
.
The cursor moves to that x value on the
first function selected in the Y= Editor,
and its coordinates are displayed.
Math Tool
Description
y1(x)=1.25x
ù
cos(x)
Summary of Contents for Titanium TI-89
Page 9: ...Getting Started 6 TI 89 Titanium keys Ë Ì Í Ê ...
Page 34: ...Getting Started 31 2 or D 2 B u s i n e s s D B D B Press Result ...
Page 43: ...Getting Started 40 3 0 D B D D B D Press Result ...
Page 44: ...Getting Started 41 D 2 0 0 2 D B Scroll down to October and press Press Result ...
Page 58: ...Getting Started 55 Example Set split screen mode to TOP BOTTOM Press Result 3 B D ...
Page 70: ...Getting Started 67 ...
Page 175: ...Operating the Calculator 172 From the Keyboard ...
Page 456: ...Tables 453 ...
Page 527: ...Data Matrix Editor 524 ...


