


3D Graphing
361
3D Graphing
Overview of Steps in Graphing 3D Equations
To graph 3D equations, use the same general steps used for
y(x)
functions as described
in
Basic Function Graphing
. Any differences that apply to 3D equations are described on
the following pages.
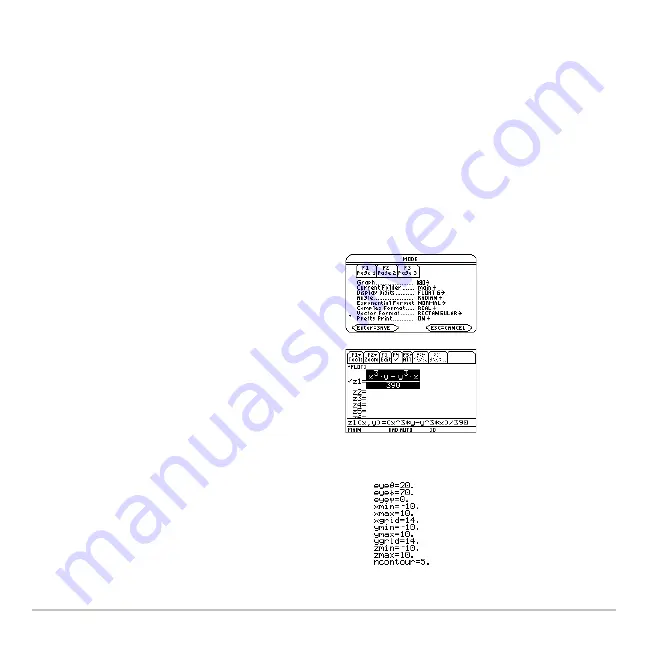
Graphing 3D Equations
1. Set Graph mode (
3
) to
3D
. Also set
Angle
mode, if necessary.
2. Define 3D equations on Y= Editor
(
8 #
).
3. Select (
†
) which equation to graph. You
can select only one 3D equation.
To turn off any stat data plots, press
‡
5
or use
†
to deselect them.
4. Define the viewing cube (
8 $
).
For 3D graphs, the viewing window is
called the viewing cube.
„
Zoom
also
changes the viewing cube.
Summary of Contents for Titanium TI-89
Page 9: ...Getting Started 6 TI 89 Titanium keys Ë Ì Í Ê ...
Page 34: ...Getting Started 31 2 or D 2 B u s i n e s s D B D B Press Result ...
Page 43: ...Getting Started 40 3 0 D B D D B D Press Result ...
Page 44: ...Getting Started 41 D 2 0 0 2 D B Scroll down to October and press Press Result ...
Page 58: ...Getting Started 55 Example Set split screen mode to TOP BOTTOM Press Result 3 B D ...
Page 70: ...Getting Started 67 ...
Page 175: ...Operating the Calculator 172 From the Keyboard ...
Page 456: ...Tables 453 ...
Page 527: ...Data Matrix Editor 524 ...


