


Basic Function Graphing
292
the current graphing mode. For example, in POLAR graphing mode, function names are
r1(
q
)
,
r2(
q
)
, etc.)
Defining a New Function
1. Press
8 #
to display the Y= Editor.
Note:
The function list shows abbreviated function names such as
y1
, but the entry
line shows the full name
y1(x)
.
2. Press
D
and
C
to move the cursor to any undefined function. (Use
2 D
and
2 C
to scroll one page at a time.)
3. Press
¸
or
…
to move the cursor to the entry line.
4. Type the expression to define the function.
•
The independent variable in function graphing is x.
•
The expression can refer to other variables, including matrices, lists, and other
functions. Only floats and lists of floats will produce a plot.
Note:
For an undefined function, you do not need to press
¸
or
…
. When you
begin typing, the cursor moves to the entry line.
5. When you complete the expression, press
¸
.
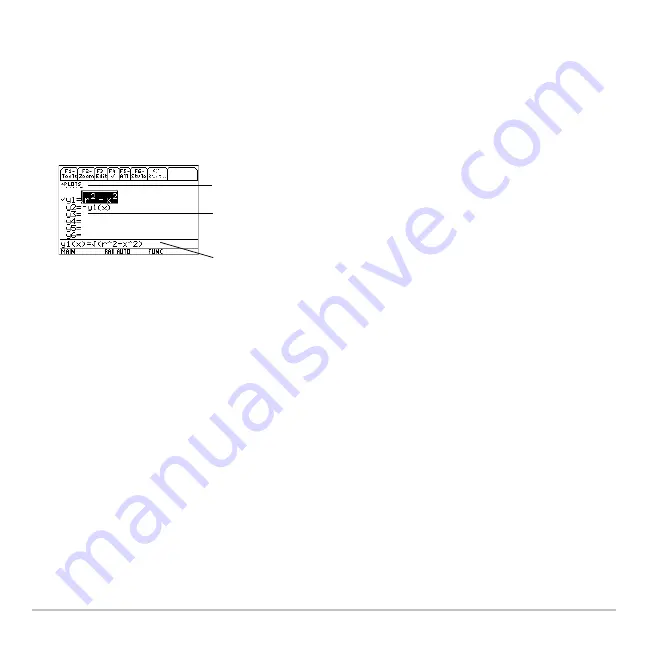
Plots
— You can scroll above y1= to see
a list of stat plots.
Function List
— You can scroll through
the list of functions and definitions.
Entry Line
— Where you define or edit the
function highlighted in the list.
Summary of Contents for Titanium TI-89
Page 9: ...Getting Started 6 TI 89 Titanium keys Ë Ì Í Ê ...
Page 34: ...Getting Started 31 2 or D 2 B u s i n e s s D B D B Press Result ...
Page 43: ...Getting Started 40 3 0 D B D D B D Press Result ...
Page 44: ...Getting Started 41 D 2 0 0 2 D B Scroll down to October and press Press Result ...
Page 58: ...Getting Started 55 Example Set split screen mode to TOP BOTTOM Press Result 3 B D ...
Page 70: ...Getting Started 67 ...
Page 175: ...Operating the Calculator 172 From the Keyboard ...
Page 456: ...Tables 453 ...
Page 527: ...Data Matrix Editor 524 ...


