


R&S ZVH
Network Analyzer Mode (R&S ZVH-K42)
Evaluating the Results
Operating Manual 1309.6946.12 - 09
192
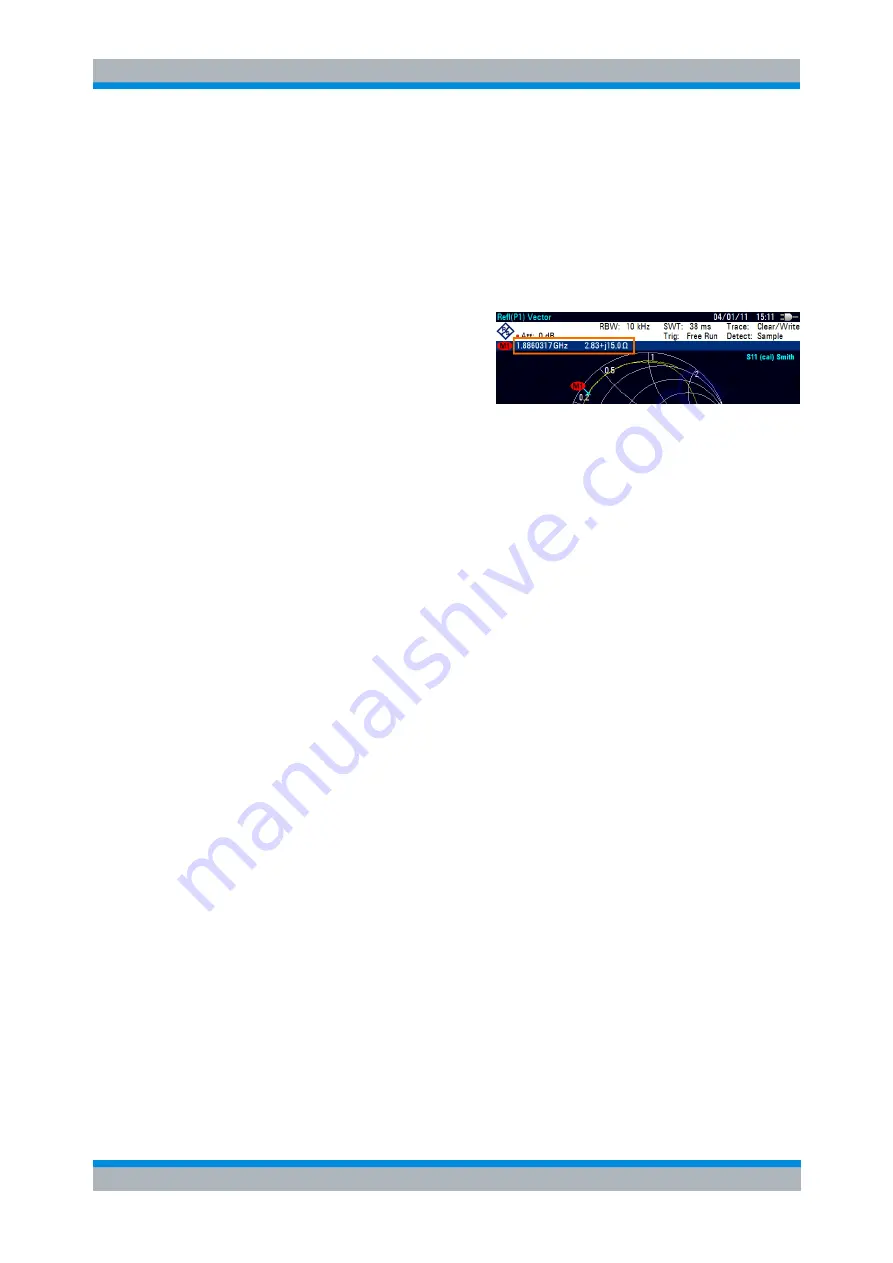
► Press the MARKER key.
The R&S ZVH activates a marker and opens the marker softkey menu. Like usual
traces, you can move the marker around with the rotary knob or the cursor keys, or
enter a specific marker position.
In its default state, the marker position is specified by the marker frequency and
complex resistance in
Ω. The complex resistance in that case is calculated according
to:
(real component) + j (imaginary component)
► Press the "Marker Mode" softkey.
► Select one of the marker formats.
The R&S ZVH adjusts the marker
information accordingly.
Selecting the reference impedance
The default reference impedance (the matching point in the center of the Smith chart)
is 50
Ω. It is, however, also possible to perform reflection measurements on networks
with another impedance.
► Press the MARKER key.
► Press the "Marker Mode" softkey.
► Select the "Ref Impedance: …" menu item.
The R&S ZVH opens an input field to select the reference impedance.
► Enter the reference impedance you need.
The value range is from 1 m
Ω to 10 kΩ.
6.3.1.2 Working with the Dual Trace Mode
When performing measurements, it is possible to perform and display two
measurements simultaneously. After activating this function, the R&S ZVH shows the
two traces in two separate diagrams. This allows you to view any combination of two
results and measurement formats on the display.
Note that the Mag Phase measurement format is an exception to this rule. This
format counts as one trace. To display the magnitude and phase as two separate
traces, assign the Phase format to trace 1 and the Magnitude format to trace 2.
► Press the TRACE key.
► Press the "Split Screen" softkey.
The R&S ZVH splits the screen. The upper screen shows trace 1, the bottom
screen shows trace 2. You can configure some aspects of the diagram
independently, like y-axis scale or displayed measurement format.


