


R&S ZVH
Spectrum Analyzer Mode (R&S ZVH-K1)
Performing Spectrum Measurements
Operating Manual 1309.6946.12 - 09
114
► Instead of entering a level range of 40 dB, enter a level range of 35 dB or even
30 dB.
This will provide a high contrast
between signal parts that are
above the noise floor, and the
noise floor, which is drawn in
black.
To show details of the noise floor
and exclude the peak levels you
have to lower the spectrogram
reference level, until it is just
above the noise floor.
The R&S ZVH will then display the signal parts that are above the reference level
in only one color, which is the color at the upper border of the color map.
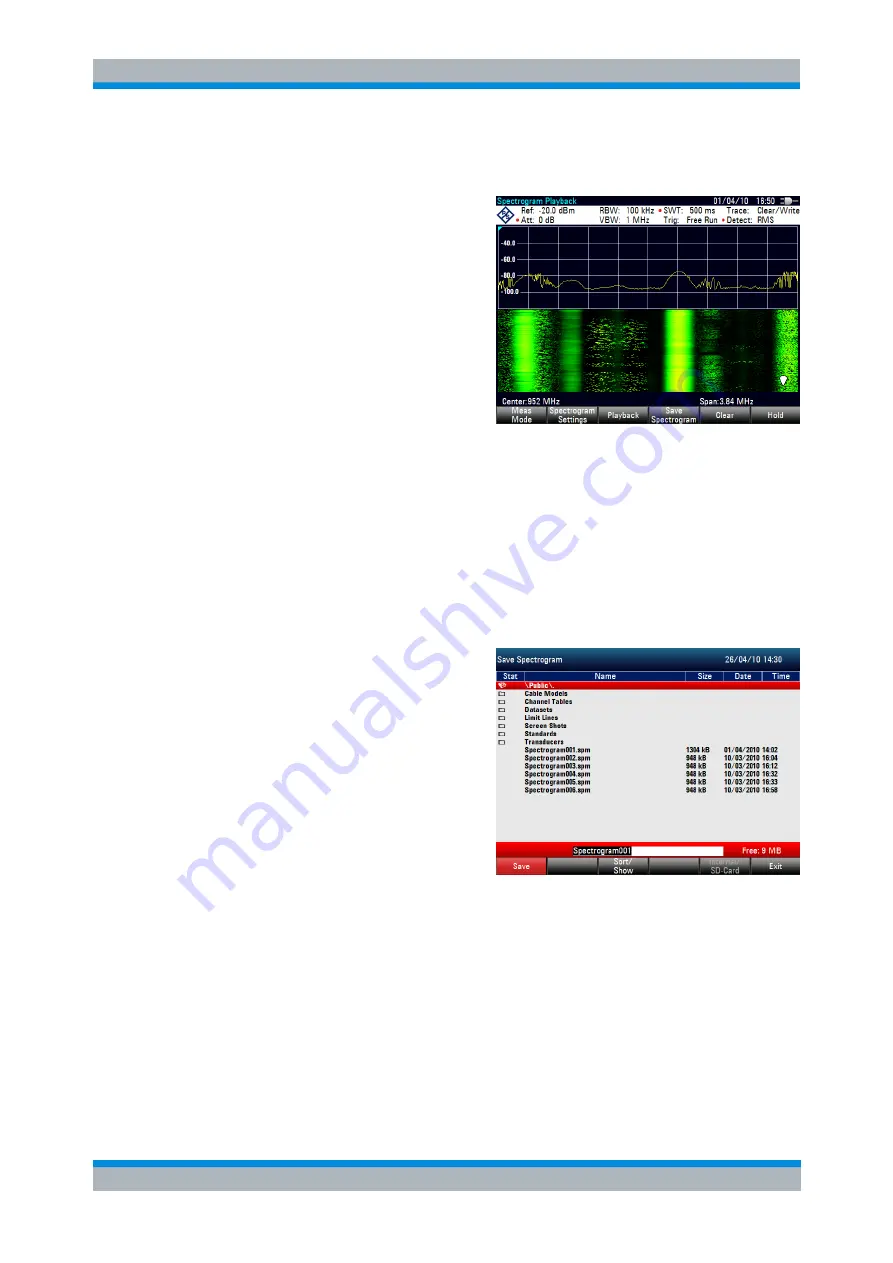
4.1.10.4 Recording a Spectrogram
You can save the data of the spectrogram for documentation or for further analysis of
the recorded data.
► Press the MEAS key.
► Press the "Save Spectrogram" softkey.
The R&S ZVH opens a dialog box
to save the current spectrogram.
► Enter the name of the spectrogram
with the alphanumeric keys.
By default, the R&S ZVH saves
the spectrogram as
'Spectrogram###' with ascending
numbers.
► Press the "Save" softkey to store
the spectrogram.
Now that you have saved the spectrogram, you can replay it any time you want.
The number of spectrograms that you can store on the R&S ZVH internal memory
depends on the other datasets that are currently on the R&S ZVH.


