R&S
®
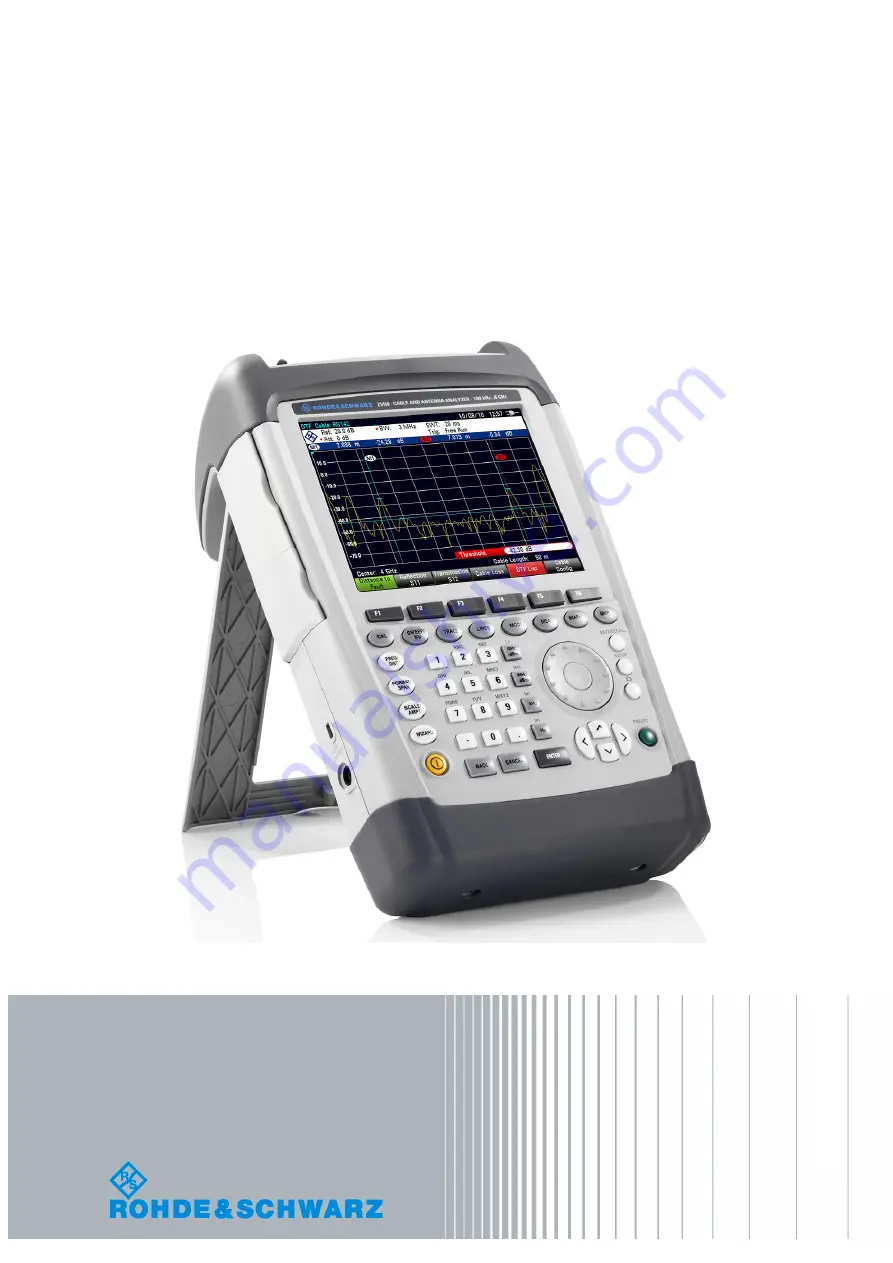
ZVH
Cable and Antenna Analyzer
Operating Manual
1309.6946.12 – 09
Oper
at
ing M
anual
Page 1: ...R S ZVH Cable and Antenna Analyzer Operating Manual 1309 6946 12 09 Operating Manual ...
Page 2: ...is manual correspond to firmware version 1 60 and higher 2017 Rohde Schwarz GmbH Co KG Muehldorfstr 15 81671 Munich Germany Phone 49 89 4129 0 Fax 49 89 4129 12 164 E mail info rohde schwarz com Internet http www rohde schwarz com 81671 Munich Germany Subject to change Data without tolerance limits is not binding R S is a registered trademark of Rohde Schwarz GmbH Co KG Trade names are trademarks ...
Page 3: ...propriate manner This product is designed for use solely in industrial and laboratory environments or if expressly permitted also in the field and must not be used in any way that may cause personal injury or property damage You are responsible if the product is used for any intention other than its designated purpose or in disregard of the manufacturer s instructions The manufacturer shall assume...
Page 4: ...ccordance with the standard definition for civil applications in the European Economic Area Definitions that deviate from the standard definition may also exist in other economic areas or military applications It is therefore essential to make sure that the tags described here are always used only in connection with the related product documentation and the related product The use of tags in conne...
Page 5: ...erating condition By taking appropriate safety measures and carefully laying the power cable you can ensure that the cable will not be damaged and that no one can be hurt by for example tripping over the cable or suffering an electric shock 4 The product may be operated only from TN TT supply networks fused with max 16 A higher fuse only after consulting with the Rohde Schwarz group of companies 5...
Page 6: ...aterial damage may occur It is the responsibility of the employer operator to select suitable personnel for operating the products 2 Before you move or transport the product read and observe the section titled Transport 3 As with all industrially manufactured goods the use of substances that induce an allergic reaction allergens such as nickel cannot be generally excluded If you develop an allergi...
Page 7: ...d 1 Cells must not be taken apart or crushed 2 Cells or batteries must not be exposed to heat or fire Storage in direct sunlight must be avoided Keep cells and batteries clean and dry Clean soiled connectors using a dry clean cloth 3 Cells or batteries must not be short circuited Cells or batteries must not be stored in a box or in a drawer where they can short circuit each other or where they can...
Page 8: ...ehicle it is the sole responsibility of the driver to drive the vehicle safely and properly The manufacturer assumes no responsibility for accidents or collisions Never use the product in a moving vehicle if doing so could distract the driver of the vehicle Adequately secure the product in the vehicle to prevent injuries or other damage in the event of an accident Waste disposal 1 If products or t...
Page 9: ...e autorizado para aplicaciones de campo y de ninguna manera deberá ser utilizado de modo que alguna persona cosa pueda sufrir daño El uso del producto fuera de sus fines definidos o sin tener en cuenta las instrucciones del fabricante queda en la responsabilidad del usuario El fabricante no se hace en ninguna forma responsable de consecuencias a causa del mal uso del producto Se parte del uso corr...
Page 10: ... leves o moderadas si no se evita AVISO indica la posibilidad de utilizar mal el producto y como consecuencia dañarlo En la documentación del producto se emplea de forma sinónima el término CUIDADO Las palabras de señal corresponden a la definición habitual para aplicaciones civiles en el area económica europea Pueden existir definiciones diferentes a esta definición en otras áreas económicas o en...
Page 11: ...ucto se deberá comprobar siempre que la tension preseleccionada en el producto coincida con la de la red de alimentación eléctrica 2 Si el producto no está equipado con un interruptor para desconectarlo de la red se deberá considerer el enchufe del cable de conexión como interruptor En estos casos se deberá asegurar que el enchufe siempre sea de fácil acceso de acuerdo con la longitud del cable de...
Page 12: ...éctrico 12 No debe introducirse en los orificios de la caja del aparato ningún objeto que no esté destinado a ello Esto puede producir cortocircuitos en el producto y o puede causar choques eléctricos fuego o lesiones 13 Salvo indicación contraria los productos no están impermeabilizados ver también el capítulo Estados operativos y posiciones de funcionamiento punto 1 Por eso es necesario tomar la...
Page 13: ...ud Por eso en caso de incendio Reparación y mantenimiento 1 El producto solamente debe ser abierto por personal especializado con autorización para ello Antes de manipular el producto o abrirlo es obligatorio desconectarlo de la tensión de alimentación para evitar toda posibilidad de choque eléctrico 2 El ajuste el cambio de partes el mantenimiento y la reparación deberán ser efectuadas solamente ...
Page 14: ... relación las normas nacionales de eliminación y reciclaje Transporte 1 Las asas instaladas en los productos sirven solamente de ayuda para el transporte del producto por personas Por eso no está permitido utilizar las asas para la sujeción en o sobre medios de transporte como p ej grúas carretillas elevadoras de horquilla carros etc Es responsabilidad suya fijar los productos de manera segura a l...
Page 15: ...rument up to date and to be informed about new application notes related to your instrument please send an e mail to the Customer Support Center stating your instrument and your wish We will take care that you will get the right information Europe Africa Middle East Phone 49 89 4129 12345 customersupport rohde schwarz com North America Phone 1 888 TEST RSA 1 888 837 8772 customer support rsa rohde...
Page 16: ...the R S ZVH 13 1 4 Configuring Measurements 13 1 5 Configuring the Instrument 14 1 6 Taking Screenshots 17 1 7 Saving Events 18 1 8 Using Antennas 20 1 9 Connecting the R S ZVH to a PC 21 1 9 1 Connecting the R S ZVH in a LAN 22 1 9 2 Connecting the R S ZVH in an Existing LAN 25 1 9 3 Connecting the R S ZVH via USB 26 1 10 Managing Datasets 27 1 10 1 Saving Datasets 29 1 10 2 Restoring Datasets 34...
Page 17: ...2 3 3 Using Display and Limit Lines 67 3 Working with the Measurement Wizard 68 3 1 Preparing the Measurement 69 3 1 1 Creating a Measurement Set 69 3 1 2 Uploading Measurement Sets 71 3 2 Using the Measurement Wizard 72 3 2 1 Starting the Measurement Wizard 72 3 2 2 Performing a Sequence of Measurements 74 3 3 Evaluating Results 77 4 Spectrum Analyzer Mode R S ZVH K1 78 4 1 Performing Spectrum Me...
Page 18: ...surements with Transducers 155 4 4 2 Setting the Reference Level 155 4 4 3 Frequency Range of Transducer 156 4 4 4 Data Sets Containing Transducer Factors 156 5 Power Meter R S ZVH K9 157 5 1 Using a Power Sensor 157 5 1 1 Connecting a Power Sensor 159 5 1 2 Performing and Configuring Measurements 160 5 2 Using a Directional Power Sensor 163 5 2 1 Connecting a Directional Power Sensor 164 5 2 2 Pe...
Page 19: ...7 1 General Functions 202 7 1 1 General R S ZVH Setup 202 7 1 2 File Management 203 7 1 3 Operating Mode Selection 203 7 2 Functions of the Cable and Antenna Analyzer 204 7 2 1 Frequency and Distance Parameters 204 7 2 2 Amplitude Parameters 204 7 2 3 Sweep Configuration 205 7 2 4 Markers 205 7 2 5 Measurement Selection and Configuration 206 7 2 6 Measurement Format Selection 206 7 2 7 Measurement...
Page 20: ...tion 213 7 4 6 Trace Functionality 213 7 4 7 Limit Lines 213 7 4 8 Markers 214 7 5 Functions of the Vector Voltmeter 215 7 5 1 Vector Voltmeter Measurements 215 7 5 2 Frequency Parameters 215 7 5 3 Amplitude Parameters 215 7 5 4 Sweep Configuration 215 7 5 5 Trace Functionality 216 7 6 Functions of the Power Meter 217 7 6 1 Power Meter Measurements 217 7 6 2 Frequency Parameters 217 7 6 3 Amplitud...
Page 21: ...with the available software options and applications Service Manual The Service Manual provides information on maintenance It covers the following topics instructions on how to perform a performance test instructions on how to repair the R S ZVH including a spare parts list mechanical drawings Release Notes The release notes describe the installation of the firmware new and modified functions elim...
Page 22: ...s KEYS Key names are written in capital letters and enclosed by quotation marks Input Input to be entered by the user is displayed in italics File names commands program code File names commands coding samples and screen output are distinguished by their font Links Links that you can click are displayed in blue font References References to other parts of the documentation are enclosed by quotatio...
Page 23: ... the R S ZVH Screen layouts that show specifics for each operating mode or measurement are provided in the corresponding sections of this manual 1 Measurement information 13 Trace 2 GPS status 14 Reference Position 3 Date and time 15 Active menu item 4 Battery status 16 Selectable menu item 5 Hardware settings 17 Currently selected menu item 6 GPS information 18 Unavailable menu item 7 Marker info...
Page 24: ...f Input Operating Manual 1309 6946 12 09 9 1 2 Means of Input The user interface of the R S ZVH provides several elements for you to input data 1 Alphanumeric keys 2 Unit keys 3 Rotary knob 4 Cursor keys 5 Enter key 6 Cancel key 7 Back key ...
Page 25: ... with the dot key If the R S ZVH asks you to enter a character or you need to enter a character e g file names the key assignment changes Each key covers one number and more than one character with the first choice being a character If you need to enter a character press the key several times until the character you require is selected The following table shows an overview of character assignment ...
Page 26: ...ident you can close it without making any changes with the CANCEL key 1 2 3 Using the Rotary Knob Using the rotary knob you can do several things The rotary knob works like a cursor key in dialog boxes or softkey submenus In that case you can navigate to one of the items with the rotary knob If the dialog box covers more than one screen page it also scrolls through the dialog box Turning it to the...
Page 27: ...or USB interfaces of the R S ZVH The product range of the R S ZVH provides several tools for remote operation Remote control with R S ZVH K40 The R S ZVH K40 is a firmware option to control the R S ZVH with remote control commands that are compatible to the SCPI standard You can download the user manual for the R S ZVH K40 from the R S website Remote desktop with R S ZVHView The remote desktop is ...
Page 28: ...ataset menu item The R S ZVH opens a dialog box to select the dataset that contains the settings you would like to have as the preset settings Select the dataset with the settings you want Select the Preset Mode menu item in the User Preferences dialog box Select the User Defined item from the dropdown menu The R S ZVH now loads the settings of the dataset after you press PRESET 1 4 Configuring Me...
Page 29: ... is automatically reset to its default value 0000 OEM Master PIN code made up out of 10 digits If you have defined a User Master PIN and enter the wrong User Master PIN five times in a row or have not defined a User Master PIN and enter the wrong PIN three times in a row the only remaining way to unlock the R S ZVH is with the OEM Master PIN The OEM Master PIN is a fix PIN that you receive upon de...
Page 30: ...o confirm the PIN Enter the 4 digit PIN again If the PIN confirmation was successful the R S ZVH shows a corresponding message and activates PIN protection In that case you have to enter the PIN every time the R S ZVH boots If the PIN confirmation was not successful the R S ZVH shows a corresponding message and does not activate PIN protection In that case repeat the last steps You can change the ...
Page 31: ...r a 10 digit number for the User Master PIN The R S ZVH opens an input field to confirm the User Master PIN Confirm the PIN The R S ZVH shows a message if the change was successful or not Alternatively select the User Master PIN Code menu item and enter a 10 digit PIN in the input field that opens ...
Page 32: ...or more information see Managing Datasets on page 27 Screenshot file name All screenshots get a default file name Screenshot The files also get numbers in ascending order beginning with 0000 You can select a default file name and start number in the User Preference menu Press the SETUP key Press the User Preference softkey Select the Default Filename and File Name Counter Starts At items and assig...
Page 33: ...e when an event occurs A screenshot of the sweep that contains the event png or jpg file A dataset of the sweep that contains the event set file Press the SETUP key Press the User Preference softkey Select the Capture Screen or Capture Dataset If on the corresponding information is included in the saved data Timing of the data capture Note that the R S ZVH evaluates the measured data after a sweep...
Page 34: ...s different modes for handling limit check failures You can select one via the Limits Save Mode Start on failure starts to save measurement data if a limit line is violated Stop on failure stops to save measurement data if a limit line is violated Save only failure saves only the sweeps that actually fail a limit check Distance interval Saves measurement data after you have covered a certain dista...
Page 35: ...ral antenna models R S HL300 Connected to the R S ZVH at the AUX port and the RF input R S HE300 Connected to the R S ZVH at the power sensor jack and the RF input R S HE400 Connected to the R S ZVH at the power sensor jack and the RF input You can control the antenna functionality in several ways in the general setup of the R S ZVH For more information see the Quick Start Guide of the R S ZVH ...
Page 36: ... You can set up a connection between the R S ZVH and R S ZVHView either via its LAN port or its mini USB port You have to install the R S ZVHView software on the PC before you are able to establish a connection Run the CD ROM delivered with the R S ZVH Navigate to the Software section and start the setup file Follow the instructions on the screen Alternatively you can download the latest R S ZVHVi...
Page 37: ...R S ZVH DHCP Dynamic Host Configuration Protocol has to be turned off which is the default state In the Instrument Setup dialog box select the DHCP item Press the ENTER key A dropdown menu to select the DHCP state opens Turn DHCP on or off as required Setting an IP address and subnet mask To establish a connection the PC and the R S ZVH have to be in the same subnet Identify the subnet mask of you...
Page 38: ... same 192 in the example below Example IP address PC 192 0 2 0 IP address R S ZVH 192 0 2 10 Identify the IP address of your PC for example in the Microsoft Windows TCP IP Properties In the Instrument Setup dialog box select the IP Address item Press the ENTER key Enter the IP address of the PC with the numeric keys Confirm the entry with the ENTER key Configuring the R S ZVHView software Start R ...
Page 39: ...tion Specify a name for the new network connection for example R S ZVH Enter the IP address for the R S ZVH in this case 192 0 2 10 Confirm the entry with the OK button The connection is now created and configured and is added to the IP Configuration list Select the new connection labeled R S ZVH Press the Connect button to establish the connection ...
Page 40: ...s with a DHCP server DHCP permits automatic allocation of the network configuration to the R S ZVH connected via LAN cable For this purpose DHCP has to be active on the R S ZVH DHCP is off by default Turn it on like this In the Instrument Setup dialog box select the DHCP item Press the ENTER key A dropdown menu to select the DHCP state opens Select On to activate DHCP The R S ZVH is now allocated ...
Page 41: ...cally The required drivers are installed along with the R S ZVHView software package When the drivers have been found on your system and the hardware has been successfully installed Windows shows a corresponding message Connect the R S ZVH via the Mini USB port to your computer Start R S ZVHView on the PC Select the USB tab in the Instrument Connect dialog box Select the R S ZVH connection Confirm...
Page 42: ...select Properties and remove the check from the Read only checkbox Use the SYSTem SET UNLock command to remove the read only attribute Note that you might have to select the correct directory first with MMEM CDIR MMEM CDIR Public Cable Models SYST SET UNL xyz cblmod Datasets Basically the R S ZVH supports various types of datasets The instructions below primarily describe managing datasets that yo...
Page 43: ...ization Control button The software opens another dialog box to control synchronization By default the software synchronizes a selected set of data depending on the synchronization direction Synchronization from PC to R S ZVH button Updates all files on the R S ZVH that have been created or edited with the R S ZVHView software package cable models limit lines transducers channel tables etc Synchro...
Page 44: ...e depends on which devices are connected to the R S ZVH If an SD card is connected datasets are always stored there first If a memory stick is connected datasets are stored there only if no SD card is connected The internal memory is used only if neither SD card or memory stick are connected The internal memory provides approximately 20 MB of data therefore the number of datasets you save on the R...
Page 45: ... can also put a name together using the quick naming feature For more information see Quick Naming of Datasets on page 31 Press the Save softkey The R S ZVH saves the dataset 1 10 1 1 Alternative Ways to Save Datasets The R S ZVH provides alternative and more comfortable ways to save datasets Using the key You can configure the key to take a screenshot as well as saving a dataset Press the SETUP k...
Page 46: ...or terms together in a logical way The various terms are combined in a table each cell of which contains one term The table consists of 120 cells You can define the contents of each cell freely Press the SAVE RECALL key Press the Save softkey Press the Quick Naming softkey The R S ZVH opens a dialog box that contains the terms Select the term you want to add with the cursor keys Press ENTER to add...
Page 47: ...softkey The R S ZVH opens an input field to define a term for the cell Define a term with the number keys and confirm the term with ENTER The R S ZVH adds the term to the table You can create and edit quick naming tables with the R S ZVHView software package and then transfer them into the internal memory of the R S ZVH In the Quick Naming softkey menu press the Import softkey Select the Import Qu...
Page 48: ...Path environment variable to the destination of the location of the exe file You can access the environment variable via the MS Windows control panel Start Menu Control Panel System Advanced System Settings Advanced tab Environment Variables button System Variables Path Add a new variable with the installation path of the software The default installation path is C Program Files Rohde Schwarz ZVH ...
Page 49: ...taset The R S ZVH provides a preview of datasets The preview is like a screenshot and lets you take a quick look at that measurement and its settings The R S ZVH does not yet activate the measurement settings of that dataset Browse through the available datasets and select the one you want Press the Recall softkey The R S ZVH shows a preview of the measurement contained in the selected dataset The...
Page 50: ...espective datasets have to be marked first Press the Mark softkey to mark files for deletion Select the dataset you d like to delete Mark the data sets with the ENTER key The selected data sets should be checked in the Status column Repeat the selection by moving the cursor with the rotary knob or the cursor key and marking more data sets with the ENTER key Press the Select Action softkey Select t...
Page 51: ...tp www rohde schwarz com product zvh html The website also provides release notes for each new firmware version The release notes include instructions on how to perform a firmware update 1 12 Installing Firmware Options You can equip the R S ZVH with several firmware options to enable additional operating modes or special measurements For more information see the Quick Start Guide ...
Page 52: ...ovides the necessary functionality to test the system equipment for its characteristics and identify faults when it is being installed or maintained Each measurement provides different aspects of the test you are performing Reflection Measurements on page 39 Distance to Fault Measurements on page 40 1 Port Cable Loss Measurements on page 41 Transmission Measurements R S ZVH K39 on page 42 Test set...
Page 53: ...e from another operating mode proceed as follows Press the MODE key Press the Antenna Cable Test softkey The R S ZVH starts the antenna and cable test mode By default the R S ZVH performs measurements on port 1 It however also supports measurements on port 2 but you have to configure those first Press the MEAS key Press the Select Driving Port softkey Select either the Port 1 or Port 2 menu item S...
Page 54: ...agnitude of the reflections in dB in a specified frequency range The reflection measurement is the default measurement Press the MEAS key Press the Reflection S11 softkey The R S ZVH starts the reflection measurement over its entire frequency range The figure shows an example of a reflection measurement without any major faults in the cable or the antenna You can perform reflection measurements on...
Page 55: ...ence signal created by the tracking generator It then performs inverse fast fourier transformation IFFT on the signal that has been received In combination with the characteristics of the cable model the R S ZVH is able to determine the distance the reflections have been travelling Because of its sensitivity by first measuring in the frequency domain and subsequent IFFT the measurement is able to ...
Page 56: ...ith a steadily declining loss over the selected frequency range and several maximums and minimums By default the R S ZVH evaluates the cable loss over its entire frequency range full span of the R S ZVH When you reduce the span make sure to define a span that is appropriate for the measurement especially for high center frequencies and consider the cable length and the wavelength of the selected c...
Page 57: ...e transmission measurement helps to find faults by displaying the magnitude of the reflections in dB in a specified frequency range Typically you perform transmission measurements on a filter to test if it works alright or test the isolation of two antennas e g two receiving antennas or a receiving and a transmitting antenna Press the MEAS key Press the Transmission S21 softkey The R S ZVH starts ...
Page 58: ...n line The VSWR format is available for DTF and reflection measurements Reflection Coeffcient Shows the reflection coefficient of the DUT The reflection coefficient is the ratio of the amplitude of a reflected wave and that of the incidental wave that occur in an electrical transmission line Cable Loss Short Open 2 This format is a refined method to calculate the cable loss When you select the for...
Page 59: ...other operating mode as calibration data is saved in the internal memory of the R S ZVH If you save the measurement in a dataset calibration data is part of that dataset When you restore the dataset and perform the same measurement again you do not have to recalibrate the R S ZVH 2 1 6 1 Calibration States The R S ZVH features several calibration states that it displays in the status line The poss...
Page 60: ... transmission norm The R S ZVH uses normalization However the normalization is not accurate because the TG power and receiver attenuation are not in line with the settings at the time it has been calibrated In that case you should perform calibration interp network analysis only The R S ZVH interpolates the correction data between the reference points of the calibration Interpolation is used when ...
Page 61: ...ides even more accurate results than the normal full 2 port calibration but takes a while longer to finish Full 1 Port Test port 1 is calibrated for measurements on that port The calibration routine requires the calibration standards open short and load to be connected one after another Easy 1 Port Test port 1 is calibrated for measurements on that port The calibration procedure requires no calibr...
Page 62: ...dard to port 1 Press the Continue softkey to start calibration The R S ZVH calibrates the Short Disconnect the Short Next the R S ZVH asks you to connect a Load 50 Ω termination to port 1 Firmly connect the Load of the calibration standard to port 1 Press the Continue softkey to start calibration The R S ZVH calibrates the Load Disconnect the Load Next the R S ZVH asks you to set up a Through conn...
Page 63: ... Selecting a Predefined Cable Model Press the MEAS key Press the DTF Settings softkey Press the Cable Config softkey Select the Select Cable Model menu item The R S ZVH opens the file manager to select the cable model Select the cable model that you are testing Confirm the selection with the Select softkey The R S ZVH shows the currently selected cable model in the diagram header Select the Desele...
Page 64: ... Enter the cable velocity Select the Loss menu item Enter the cable loss You can now perform measurements on the temporary cable definition Note that as soon as you change any cable parameter or load another cable model the temporary data is lost and you have to define it again if you have to perform further measurements After you have defined the cable characteristics you still have to activate t...
Page 65: ...he peak Return Loss Shows the magnitude of the peak To limit the information in the list you can define a threshold for the DTF list so that only peaks above a certain level are included in the list Press the MEAS key Press the DTF Settings softkey Press the DTF List Threshold softkey The R S ZVH opens an input field to define a threshold in dB Enter the threshold you want The R S ZVH now only sho...
Page 66: ...s 2 2 2 1 Setting the Frequency Range for DTF Measurements In the default setting the R S ZVH automatically selects a center frequency of 1 GHz and a distance of 50 m The R S ZVH optimizes the settings for the best resolution if you change the stop distance If you have to keep the current frequency settings it is best to define a manual span Setting the frequency span When setting the frequency ra...
Page 67: ... the start frequency and stop frequency you need The R S ZVH adjusts the frequency range according to your settings Note that the distance from start to stop frequency has to be equal to the span The R S ZVH adjusts the values if you enter a frequency range that is not the same as the span 2 2 2 2 Setting the Start and Stop Distance for DTF Measurements The start and stop distance define the scali...
Page 68: ...the center frequency with the center frequency being in the middle of the horizontal axis Alternatively you can directly set the start and stop frequency Press the FREQ DIST key Press the Center softkey Enter the center frequency you need Alternatively set the frequency range independent of span and center frequency Press the FREQ DIST key Press the Start softkey and enter a start frequency Press ...
Page 69: ...nter the reference value you want or move the reference with the rotary knob The R S ZVH sets up the display accordingly Defining the display range The display range defines the scale of the vertical axis and therefore the amplitude between two horizontal grid lines The unit depends on the measurement format When you change the display range you can increase or decrease the amplitude the R S ZVH d...
Page 70: ...e When you change the reference position the R S ZVH also shifts the position of the trace by the magnitude of the reference position change It has no effect on the reference value itself Press the SCALE AMPT key Press the Range Ref Pos softkey Select the Ref Position menu item Enter the reference position you want The R S ZVH moves the trace accordingly 2 2 3 2 Setting the Attenuation The R S ZVH...
Page 71: ...e generated signal Press the SCALE AMPT key Press the TG Power softkey Enter the desired output level of the signal in dBm Tracking generator output level Using an output level of 0 dBm or a receiver attenuation of 0 dB for S12 or S21 measurements can cause an overload at the RF input It is therefore recommended to use an output level of 10 dBm default or lower for these measurements This especial...
Page 72: ... between measurement speed and good performance Press the Manual Meas BW softkey The R S ZVH opens an input field to define the measurement bandwidth Enter the measurement bandwidth you want to work with As an indicator that the BW is no longer coupled to the span the R S ZVH displays a red dot in front of the BW item in the hardware settings 2 2 5 2 Selecting the Sweep Mode The sweep mode is the ...
Page 73: ...the selected frequency range The number of points also defines the resolution and therefore the accuracy of the measurement and affects the measurement time In the default state the R S ZVH evaluates 201 measurement points This number allows for fast measurement times and sufficient accuracy For measurements with a higher or lower frequency resolution you can change the number of measurement point...
Page 74: ...signal The external trigger signal is fed in via the BNC connector Ext Trigger The switching threshold is 1 4 V i e a TTL signal level Select the trigger you need for your measurement The trigger readout Trig shows the current trigger setting When external trigger are selected you can delay the start of the measurement with respect to the trigger event by entering a delay time In this way time dif...
Page 75: ...aults in the system you are measuring The R S ZVH provides a method to suppress signals resulting from interfering sources without affecting the accuracy of the actual measurement Press the TRACE key Press the Trace Mode softkey Select the Suppression On menu item to activate suppression of interference The R S ZVH looks for signals that interfere with the measurement and suppresses them in the re...
Page 76: ...rs the trace to the trace memory Press the Show Memory softkey The R S ZVH displays the saved trace in white You can remove the memory trace by pressing the Show Memory softkey again The memory traces are bit mapped into the picture memory Therefore when the memory trace is recalled it will not be adapted to any modifications of the reference level or span that may have been made in the meantime W...
Page 77: ...o fault and cable loss measurements and dBm for all others The position of a delta marker is indicated by a dashed line to distinguish it from a normal marker The delta marker level is always a relative to the main marker level and so the delta marker level unit is always dB The delta marker frequency is always relative to the main marker in other words the delta marker frequency is the frequency ...
Page 78: ...rsor keys the step size is 10 of the span Position the marker with the rotary knob When positioning the marker with the rotary knob the step size is one pixel Enter a marker position with the number keys and confirm the entry with one of the unit keys Confirm the marker position with the ENTER key The marker input field closes By default the marker list above the diagram area is active The marker ...
Page 79: ...e delta marker position with the rotary knob or the cursor keys Confirm the delta marker position with the ENTER key The delta marker input field closes To add more markers press the New Marker softkey several times until you have the number of markers you want in the display 2 3 2 3 Selecting the Marker Type When you add new markers they will be delta markers by default Their coordinates are rela...
Page 80: ...ive marker or delta marker on the next highest level value of the trace relative to its current position Set to Minimum The Minimum function places the active marker or delta marker on the lowest value of the trace Press the MKR key Press the Set to Peak Set to Next Peak or Set to Minimum softkey The R S ZVH positions the marker accordingly Sorting markers A special marker function available for d...
Page 81: ... menu item Confirm the selection with the ENTER key The R S ZVH deletes the marker Deactivating markers If you delete marker 1 M1 all delta markers that are relative to that marker are also deleted Removing delta markers only Press the MARKER key Press the Delete Marker softkey Select the Delete All Delta menu item Confirm the selection with the ENTER key The R S ZVH deletes all delta markers Remo...
Page 82: ...menu item Confirm the selection with the ENTER key The R S ZVH opens an input field to define the lower limit of the search range Enter the lower limit Confirm the entry with one of the unit keys If the span is wide enough the R S ZVH displays a red vertical line to indicate the lower limit Define the upper search limit the same way Deactivating marker search limits Press the Search Limits softkey...
Page 83: ...a sequence of measurements or measurement set Because all relevant parameters have been set prior to the actual measurement and cannot be changed once the measurement procedure has begun the wizard is a good way to avoid mistakes and save time when setting up measurements This chapter describes the functionality of the measurement wizard For details on the individual measurements you can perform w...
Page 84: ...dataset is a file that contains the settings of a specific R S ZVH configuration for example frequency scaling etc To get hold of a dataset set up the R S ZVH as you need and save the configuration or use one of the predefined datasets For more information on datasets see Saving Datasets on page 29 Start the R S ZVHView software on your PC Select the Wizard Set Editor with the button The R S ZVH o...
Page 85: ...define a name for the corresponding measurement include instructions verbal or graphical about performing the measurement define several hardware settings as described in the Quick Start Guide select a calibration method specific for that measurement You can add instructions for every measurement that you include in the set to avoid handling measurements incorrectly The R S ZVH shows these instruc...
Page 86: ...that contains the set of measurements to the R S ZVH Select the Wizard Set Control function with the button The R S ZVH opens a dialog box to select the measurement set s to upload Select the measurement set you want to upload Copy the files with the button The software stores a copy of the measurement set in the memory of the R S ZVH Alternatively you can use a memory stick or SD card to access a...
Page 87: ... information about the measurement set you have just loaded The dialog box contains the following information Measurement Definition Name of the wizard definition file currently in use Pressing the ENTER key on this field has the same effect as the Load Meas Set softkey Measurement Description Short description of the measurement task This is a read only field that shows the description as defined...
Page 88: ... cable that you perform the measurement on Calibration Calibration method to use before the measurement starts This is a read only field the calibration method has to be defined with R S ZVHView You have to calibrate the R S ZVH before you can begin with the measurement sequence defined in the wizard If the R S ZVH has already been calibrated with the defined routine prior to starting the wizard t...
Page 89: ...pool to the measurement configurations and required calibration methods in the measurement sequence If the R S ZVH has already been calibrated for a particular configuration it restores that data Another calibration is not necessary If the R S ZVH has not been calibrated for a particular configuration yet calibration becomes necessary The new calibration data is added to the pool Therefore calibra...
Page 90: ...roceeding with the measurement Press the No softkey if changes are not required and proceed with the measurement After each measurement step you have several options Continue with the next measurement Continue softkey Finishes the current measurement and begins with the next measurement by showing the necessary preparations Repeat the current measurement Repeat Meas softkey Repeats the current mea...
Page 91: ...eady finished are lost When you have finished all measurements that are part of the measurement set the R S ZVH asks you if you want to save the measurement results Press the Save Meas Results softkey The R S ZVH saves the results on the selected storage device Limited internal memory If you have to store the results on the internal memory make sure that it has enough space left to store them Else...
Page 92: ...port with the R S ZVHView Select the Report Generator with the button The R S ZVH opens a dialog that provides all functionality to manage measurement sets 1 Source folder of the datasets 2 Preview of a particular dataset 3 Measurement data to be included in the report 4 Selection of the included information on each report page 5 Selection of the output format 6 Save load a report With the report ...
Page 93: ...uency domain or keep track of a signal in the time domain They provide a basic overview of the input signal characteristics Frequency domain In the frequency domain the R S ZVH analyzes the input signal characteristics over a particular span You can use it for example to obtain basic measurement results like peak levels and the shape of the spectrum The horizontal axis shows the frequency the vert...
Page 94: ...s the total power of the channel by integrating the results on the trace The R S ZVH takes the following parameters into account display mode absolute or relative detector resolution bandwidth That means that you can compare the result to the result that would have been obtained from a thermal power meter The small resolution bandwidth acts like a narrow channel filter and so prevents out of chann...
Page 95: ...The number of standards the R S ZVH can store in its memory depends on the number of other data sets stored on the R S ZVH For more information see Managing Datasets on page 27 4 1 2 2 Setting the Reference Level The reference level is the power level that the R S ZVH expects at the RF input When selecting the reference level make sure that you do not overload the R S ZVH by applying a signal whos...
Page 96: ...sets yields optimal results But sometimes you also need to see the spectrum outside the current span to detect other signal components that you need to include in the measurement Therefore you can adjust the span to up to ten times the channel bandwidth and hence still be able to see the spectrum outside the measurement channel Press the FORMAT SPAN key In the default configuration Auto Span is ac...
Page 97: ...r display switches from Power to Max Power If you want to deactivate the Max Hold function and return to the normal power display activate Clear Write To deactivate the Max Hold function press the Power Display softkey Select the Clear Write menu item The power display returns to Power display 4 1 2 6 Unit for Power Display The R S ZVH can apply different units to the power output The default unit...
Page 98: ...default setting If you need another percentage for the occupied bandwidth you can set values from 10 to 99 9 After entering the channel bandwidth the R S ZVH automatically selects the measurement parameters so that you can attain the best result Press the MEAS key Press the Meas Mode softkey The R S ZVH opens the measurement menu Select the Occupied BW menu item The R S ZVH starts to measure the o...
Page 99: ...changes to the settings or create datasets note that the span is always coupled to the channel bandwidth Changes to either of those automatically adjust the other 5 x channel bandwidth the resolution bandwidth should be between 1 and 4 of the channel bandwidth This ensures that the occupied bandwidth is measured with high accuracy the video bandwidth must be at least three times the resolution ban...
Page 100: ...s the power measurement Press the MEAS key Press the Chan BW softkey The R S ZVH opens an input field to specify the channel bandwidth Enter the channel bandwidth you need The R S ZVH sets the appropriate span for the channel bandwidth that you have entered span 5 x channel bandwidth This ensures that no incorrect channel power measurements are made The minimum channel bandwidth that you can set i...
Page 101: ...spectrum outside the measurement channel Press the FORMAT SPAN key In the default configuration Auto Span is active The R S ZVH automatically sets the optimal span for the channel power measurement Press the Manual Span softkey The R S ZVH opens an input field to define the span manually Enter the span you need The largest possible span for the channel power measurement is ten times the channel ba...
Page 102: ... external or video trigger and specify the power measurement time To prevent incorrect power measurements in the time domain make sure that the whole signal is within the selected resolution bandwidth If the resolution bandwidth is too small the displayed power will be lower than the actual power Press the MEAS key Press the Meas Mode softkey The R S ZVH opens the measurement menu Select the TDMA ...
Page 103: ...USB or the LAN interface The number of standards the R S ZVH can store in its memory depends on the number of other data sets stored on the R S ZVH For more information see Managing Datasets on page 27 4 1 4 2 Setting the Burst Length The burst length is the measurement time that the R S ZVH performs measurements with The burst length can be equal or less than the sweep time Press the MEAS key Pre...
Page 104: ...ent the R S ZVH sets the ideal reference level 4 1 4 4 Using a Trigger Usually you will apply a trigger when measuring bursts If a trigger is active the R S ZVH uses the video trigger for TDMA measurements by default The video trigger level is at 50 of the range of the vertical axis but is variable This means the R S ZVH triggers a measurement if the rising edge of the burst exceeds this 50 line I...
Page 105: ...ks like the channel power measurement in that it determines the spectrum within the channel using a resolution bandwidth that is small compared to the channel bandwidth In addition to the channel bandwidth the ACLR measurement is also defined by the channel spacing the bandwidth of adjacent channels and the adjacent channel spacing The R S ZVH supports measurements on up to 12 carrier channels and...
Page 106: ...d by adding the channel spacing and the channel bandwidth Selecting the frequency span If the frequency span is too large in comparison to the channel bandwidth or the adjacent channel bandwidths being examined only a few points on the trace are available per channel This reduces the accuracy of the waveform calculation for the channel filter used which has a negative effect on the measurement acc...
Page 107: ...the signal to be measured The whole IF envelope is used to calculate the power for each measurement point The IF envelope is digitized using a sampling frequency which is at least five times the resolution bandwidth which has been selected Based on the sample values the power is calculated for each measurement point using the following formula N i i RMS s N P 1 2 1 with si linear digitized video v...
Page 108: ... ZVH For more information see Managing Datasets on page 27 4 1 5 2 Configuring the Measurement In addition to creating and editing standards with the R S ZVHView software the R S ZVH also provides functionality to set up a measurement configuration Setting the number of transmission channels Press the MEAS key Press the Channel Settings softkey Select the Tx Channels menu item The R S ZVH opens an...
Page 109: ...kHz Setting the channel spacing In case of the R S ZVH the channel spacing is defined as the distance between the center frequency of the transmission channel and the center frequency to the next transmission channel or the distance between the center frequency of the transmission channel and the center frequency of the adjacent channel Specific channel spacing definitions Note that some some radi...
Page 110: ... Even number of TX channels The two TX channels in the middle are used to calculate the frequency between those two channels This frequency is aligned to the center frequency Adjacent or alternate channel spacing is also available for single carrier measurements The R S ZVH can perform measurements on up to 12 adjacent channels Usually the first adjacent channel to the Tx channel is referred to as...
Page 111: ...ative Results You can set up the result display to either show the absolute power of the adjacent channels or the power relative to one of the transmission channels Press the MEAS key Press the Power Display softkey Select either the Absolute menu item to display the absolute results or the Relative menu item to display the power relative to one of the transmission channels 4 1 5 5 Selecting the R...
Page 112: ...e Channel Settings softkey Select the Channel Limit Relative menu item The R S ZVH opens a dialog box to define the relative limits for each adjacent channel Select the channel you want to define a limit for Activate the input by pressing the Select softkey The channel turns green and the check box in the first column is marked Enter the limit value you need The R S ZVH automatically activates the...
Page 113: ...Performing a limit check Press the Channel Settings softkey Select the Check Channel Limits menu item The R S ZVH automatically performs limit checks The results of the limit check are displayed in the table above the trace If a result fails the limit check it turns red and has a star in front of its power level ...
Page 114: ...erform measurements in frequency ranges other than the predefined ones To learn how to define Spectrum Emission Masks refer to the R S ZVHView manual Press the MEAS key Press the Meas Mode softkey The R S ZVH opens the measurement menu Select the Spectrum Emission Mask menu item The R S ZVH starts to measure the spectrum emission mask Note that the frequency range of the actual measurement depends...
Page 115: ...ements that are conform to a telecommunications standard you can activate one of the predefined standards that are already stored in the R S ZVH memory However you can create new configurations to perform measurements on other standards as well Press the MEAS key Press the Standard softkey The R S ZVH opens a dialog box to select the standard Select one of the available standards Confirm the selec...
Page 116: ...nel PASS FAIL information If the signal is within the limits of the spectral mask the R S ZVH shows if not it shows Range Hz Frequency range The first number is the start frequency the second number the stop frequency of each defined frequency range The character following the number indicates the unit k kHz M MHz G GHz RBW Hz Resolution bandwidth the corresponding frequency range is measured with...
Page 117: ...highest signal in the defined frequency range It then adjusts the frequency axis so that all harmonics are visible In zero span mode the center frequency remains the same Press the MEAS key Press the Meas Mode softkey Select the Harmonic Distortion menu item The R S ZVH starts to measure the harmonic distortion The search for harmonics starts as soon as you enter the Harmonic Distortion measuremen...
Page 118: ...s well as dB If you want to see more than one harmonic the R S ZVH can show up to six harmonics Press the MEAS key Press the Harmonics softkey Enter the number of harmonics you d like to see 4 1 7 2 Optimizing the Display of Harmonics The R S ZVH places the markers on the other harmonics even if they are outside of the display range Press the MEAS key Press the Adjust Settings softkey The R S ZVH ...
Page 119: ... measurement the R S ZVH places three markers on the trace The first marker is placed on the peak power level The R S ZVH assumes that position as the level of the carrier The second and third markers are delta markers These are placed symmetrically on the adjacent peak values to the left and right of the carrier Screen layout for the AM modulation depth measurement 1 Marker list 2 Modulation dept...
Page 120: ...R S ZVH will not set the markers and therefore will not calculate the modulation depth Press the MEAS key Press the Threshold softkey The R S ZVH opens an input field to set the threshold Enter the threshold value you need The threshold is represented as a horizontal blue line in the diagram area 4 1 8 2 Optimizing the Settings In order to get the best results you can use the automatic adjustment ...
Page 121: ...equency spectrum To avoid long measurement times the spectrum is split into several smaller ranges Each of those ranges has a different configuration for example a different RBW The Spurious Emission measurement available on the R S ZVH is designed for measurements on category A 3GPP base stations with the appropriate configuration in each measurement range Press the MEAS key Press the Meas Mode s...
Page 122: ...onding subrange If you d like to analyze other locations on the trace use normal marker and deltamarker functionality For more information see Using Markers and Deltamarkers on page 145 4 1 9 1 Defining the Channel Bandwidth Several frequency bands have been defined for 3GPP transmissions Depending on the frequency band you are testing you have to adjust the start and stop frequencies of the carri...
Page 123: ...ing ranges have been defined 9 kHz to 150 kHz with an RBW of 1 kHz 150 kHz to 30 MHz with an RBW of 10 kHz 30 MHz to 1 GHz with an RBW of 100 kHz 1 GHz with an RBW of 1 MHz The spurious list contains the following information for each range Frequency range Start and stop frequencies of the range RBW Resolution bandwidth that the R S ZVH uses within that range Peak Frequency Frequency at which the ...
Page 124: ...ertical axis represents time Time in the spectrogram runs chronologically from top to bottom Therefore the top of the diagram is the present A third dimension shows the amplitude for each frequency by mapping different colors to every power level The result is therefore a two dimensional diagram The color the R S ZVH assigns to a power level that was measured depends on the color table you have se...
Page 125: ...e if you are in continuous sweep mode If you are in single sweep mode the R S ZVH does not add a line to the spectrogram until you initiate the next single sweep You can stop the update of the spectrogram in continuous sweep mode Press the MEAS key Press the Hold softkey Note that in continuous sweep mode the measurement in the spectrum result display does not stop The trace in the upper window st...
Page 126: ...ress the CANCEL key Use the rotary knob or the UP and DOWN cursor keys again The R S ZVH resumes scrolling through the spectrogram history The symbols on the right side of the spectrogram indicate the position of the spectrogram part currently displayed on the screen A single down arrow in the right lower corner of the spectrogram indicates that the uppermost frame still represents the most recent...
Page 127: ...suring Let s say for example that the signal has an amplitude range of about 30 dB with the maximum amplitude at about 60 dBm and the minimum amplitude at about 100 dBm and the Green Yellow color scheme With the default settings the spectrogram is made up exclusively of green colors and it s not easy to distinguish amplitude levels That s because the yellow color shades are completely out of range...
Page 128: ... the example the level range of the signal is from about 60 dBm to about 100 dBm Therefore set the level range to 40 dB to get the whole signal As the level range is now adjusted the R S ZVH is able to map its complete color range to the level range of the signal This means that signal parts with a low amplitude are in a shade of green while signal parts with a high amplitude are yellow The best w...
Page 129: ...ference level in only one color which is the color at the upper border of the color map 4 1 10 4 Recording a Spectrogram You can save the data of the spectrogram for documentation or for further analysis of the recorded data Press the MEAS key Press the Save Spectrogram softkey The R S ZVH opens a dialog box to save the current spectrogram Enter the name of the spectrogram with the alphanumeric ke...
Page 130: ...o the same things on a recalled spectrogram as in the spectrogram recording mode e g customize the display to your needs In addition to that functionality it is possible to view not only the spectrum that belongs to the currently selected spectrogram frame but also the spectrums of all frames that are in the memory of the R S ZVH Working with time lines in playback mode To find a particular point ...
Page 131: ...r to the top most frame Press the Select Time Line softkey again The R S ZVH opens an input field to define the position of the second time line T2 Enter a number with the number keys the rotary knob or the cursor keys The R S ZVH positions the second time line on the selected frame Again it shows the time stamp of the time line in the marker information field ΔT value For the second time line T2 ...
Page 132: ...en the event shown in the spectrum occurred For more information on marker functionality see Using Markers on page 62 Switching back to active spectrogram recording To resume recording of a new spectrogram Press the Live Update softkey at any time you are in playback mode The R S ZVH switches back to performing live measurements Long Time Spectrograms The R S ZVH can record spectrogram data up to ...
Page 133: ... Selects the way the spectrogram is controlled Timer Recording starts and stops on a certain date and time You can define the date via the Start Stop Date and Start Stop Time menu items for example from 6 00 am to 6 00 pm on January 1st in the year 3000 You can also define a Duration instead of specifying a stop time Immediately Recording begins immediately and you can define a Duration for exampl...
Page 134: ... while the main window shows a detailed view of the measured data Apply different color schemes via the Colors menu The color schemes are the same as those available within the firmware See Error Reference source not found on page Error Bookmark not defined Select a certain time line in the spectrogram and view the corresponding spectrum in the diagram area below the spectrogram Zoom into and out ...
Page 135: ...key Select the Isotropic Antenna menu item After you have turned the isotropic antenna on the R S ZVH uses the isotropic antenna for all measurements Note that when you turn the isotropic antenna on without having selected a transducer factor first the R S ZVH asks you to select a transducer factor Using transducer factors The isotropic antenna is in effect a transducer Because it has a characteri...
Page 136: ...antenna consists of three orthogonal elements Each of these elements measures the field strength from a different direction x y and z axis Decrease of measurement speed Because the R S ZVH performs a measurement on each of the three antenna axes the update rate of the results decreases slightly You can select to display different aspects of the measurement Press the Meas Mode softkey Select the Is...
Page 137: ...cy represents the frequency at the center of the horizontal axis in the diagram area Press the FREQ DIST key The R S ZVH opens the frequency menu When you press the FREQ DIST key the R S ZVH automatically opens an input field to define the center frequency If the input field is inactive you can open it with the Center Freq softkey Enter the center frequency you need The frequency you have entered ...
Page 138: ...an input field to define the step size 4 2 1 3 Setting a Frequency Offset For measurements on frequency converters such as satellite downconverters it is often convenient to reference the results to the frequency prior to conversion For this purpose the R S ZVH offers a frequency offset that arithmetically shifts the center frequency to higher or lower frequencies Thus the R S ZVH displays the inp...
Page 139: ...p frequency to the possible maximum The label of the horizontal axis changes from Center and Span to Start and Stop 4 2 1 5 Setting the Span The span is the frequency range around the center frequency that a spectrum analyzer displays on the screen The span you should select depends on the signal and the measurement that you are performing A rule of thumb is that it should be at least twice the ba...
Page 140: ... displaying the entire frequency range Time domain measurements You can also activate time domain measurements without having to enter the value manually When measuring in the time domain the span is 0 Hz In that state the R S ZVH measures the signal at the current center frequency only Instead of displaying the spectrum the R S ZVH shows the signal power over a certain time period The horizontal ...
Page 141: ...nals are within the measurement diagram Press the SCALE AMPT key When you press the AMPT key the R S ZVH automatically opens an input field to define the center frequency If the input field is inactive you can open it with the Ref Level softkey Enter the reference level you require If you change the reference level the R S ZVH adjusts the position of the trace as you make the changes By default th...
Page 142: ...pressed as a percentage of the reference level Linear scaling is useful to display AM modulated carriers in the time domain for example Press the SCALE AMPT key Press the Range Ref Pos softkey The R S ZVH opens a submenu to select the display range Select the display range you need Manual Range allows you to select a custom range The R S ZVH adjusts the vertical axis accordingly 4 2 2 3 Selecting ...
Page 143: ...er It is coupled directly to the reference level If you have set a high reference level RF attenuation is turned on in 10 dB steps according to the table below so that the input mixer always remains in the linear range The R S ZVH provides three attenuation modes Auto Low Distortion If this mode is active the R S ZVH sets the RF attenuation 10 dB higher according to the table below making the stre...
Page 144: ...ss the SCALE AMPT key Press the RF Att Amp Imp softkey Select either the Auto Low Distortion or the Auto Low Noise menu item The R S ZVH sets the attenuation according to the table above Select the Manual 0 dB menu item for manual selection of the RF attenuation The R S ZVH opens an input field to set the RF attenuation You can set the attenuation from 0 dB to 40 dB in 5 dB steps To indicate a man...
Page 145: ... selects a 75 Ω matching pad connected at the RF input The 50 75 Ω matching pad R S RAZ is recommended for 75 Ω matching see recommended accessories The R S ZVH automatically considers the conversion factor when a value of 75 Ω is set Press the SCALE AMPT key Press the RF Att Amp Imp softkey Select the impedance you need You can also use other matching pads e g R S RAM or R S FSH Z38 by activating...
Page 146: ...played noise changes by 10 dB The resolution bandwidth affects the speed of the measurement If you want to display the true spectrum the resolution filters have to settle at all frequencies that are of interest Narrow bandfilters have a longer settling time compared to wide ones Therefore the sweep time increases the smaller the resolution bandwidth gets The rule is that if you reduce the bandwidt...
Page 147: ... resolution filters this value would be exceeded for large spans In order to avoid this the R S ZVH adjusts the span automatically as soon as the maximum sweep time is reached 4 2 3 2 Setting the Video Bandwidth The video bandwidth VBW basically smoothes the trace by reducing the noise and therefore making power levels easier to see The noise reduction is a result of the video filter This lowpass ...
Page 148: ... video bandwidth accordingly The effects of the video bandwidth on measurements are as follows if you are performing measurements on modulated signals the video bandwidth must be sufficiently large so that significant modulation components are not rejected RBW if you want to keep signals free of noise you should select the smallest video bandwidth possible 0 1 x RBW if you are performing measureme...
Page 149: ...n If you increase the span you also have to increase the sweep time In its default state the R S ZVH couples the sweep time to the span and the resolution bandwidth to avoid invalid settings If the coupling is active the R S ZVH always sets the shortest possible sweep time to make sure that the display of the spectrum is correct and valid The R S ZVH requires a minimum sweep time of 20 ms for ever...
Page 150: ...weeps included in a single sweep see Selecting the Trace Mode Average Press the SWEEP BW key Press the Trigger softkey Select the Single Sweep menu item to perform measurements in single sweep mode or the Continuous Sweep menu item to perform measurement continuously 4 2 4 3 Working with Trigger Functionality If you have to perform measurements according to certain signal conditions you can use a ...
Page 151: ...easurement is resumed etc Pulsed signals can be measured by this method if the gate delay and gate length are selected in a way that the measurement is only performed while the pulse is active Gated measurements are possible in the frequency domain span 0 and the time domain span 0 but it is available only in combination with an external gate signal Note that gated trigger is not available if you ...
Page 152: ...e external trigger is active the Gated Trigger menu item becomes available Press the Trigger softkey again Select the Gated Trigger menu item In order to get appropriate results you have to set the gate delay and gate length in a way that the measurement is active during the interesting part of the signal You can also modify the sweep time in order to match the horizontal axis to the length of the...
Page 153: ...e R S ZVH returns to the frequency domain provided it was active before setting up the gated trigger The original span is restored The R S ZVH is ready to perform measurements with an accurately set gate 4 2 4 4 Selecting the Sweep Type The sweep type defines the way how the R S ZVH captures and processes the data Press the SETUP key Press the User Preferences softkey Select the Sweep FFT menu ite...
Page 154: ...p is not possible under the following circumstances For measurements in the time domain zero span For TDMA Power Spectrum Emission Mask and Spurious Emission measurements For measurements with a gated trigger If the frequency span is smaller than the resolution bandwidth RBW If the the resolution bandwidth RBW is greater than 300 kHz ...
Page 155: ...n the vicinity of noise You can apply all detectors in this mode Max Hold The trace shows the maximum power levels that have been measured at each pixel To overwrite a max hold trace change a parameter in a way that the results can not be compared any more e g the span Using the max hold trace mode is a good way to detect intermittent signals or the maximum values of fluctuating signals for exampl...
Page 156: ...ment results to fit them on the display In that case one pixel represents a frequency range span 631 The detector determines the way the R S ZVH combines and displays the results for one pixel The data base is the video voltage of the analyzer The R S ZVH provides several types of detectors Auto Peak If the auto peak detector is active the R S ZVH displays both the maximum and the minimum power le...
Page 157: ...odulated signals because it provides stable and true power readings In combination with a high sweep time you can increase the display stability even more because the measurement time for each pixel increases Noise measurements also provide stable results if you apply the RMS detector in combination with a high sweep time However the bandwidth occupied by the signal to be measured should at least ...
Page 158: ... to compare for example two different detector settings In the default state only trace 1 is active Press the TRACE key Press the Show softkey Select the Trace 2 menu item The R S ZVH shows the second trace The second trace is in a different color To show that the second trace is active the R S ZVH labels the Trace 2 menu item with an X After you have activated the second trace this is also the ac...
Page 159: ...store it at a later time you can display the memory trace as if it is a normal memory trace Press the TRACE key Select the trace you want to store in the trace memory with the Select Trace softkey Press the Trace Memory softkey The R S ZVH saves the active trace Press the Show softkey Select the Memory x menu item The R S ZVH shows the corresponding memory trace If active it labels the Memory x me...
Page 160: ...tion calculates the noise power density at the marker position in dBm Hz The R S ZVH includes several variables in the calculation of the noise power density including the trace pixel values the resolution bandwidth the detector and the level display mode absolute or relative To stabilize the noise power display the R S ZVH uses the pixel the marker is on and four pixels to the right and four pixe...
Page 161: ... baseband signal The frequency counter only gives completely accurate readings for sine signals that are at least 20 dB above the noise floor If the S N ratio is less noise affects the results Press the MARKER key Press the Marker Function softkey Select the Frequency Count menu item The R S ZVH displays the counted marker If the frequency counter is on the marker symbol changes from M1 to C The r...
Page 162: ...er bandwidth Demodulating Signals The R S ZVH features an AM and FM demodulator to demodulate and monitor audio signals It demodulates the signal at the marker frequency You can listen to the demodulated signal with the internal speaker or headphones that you can connect to the 3 5 mm headphone jack on the top of the R S ZVH When demodulating an AM modulated signal the R S ZVH turns the video volt...
Page 163: ...ns an input field to define the demodulation time Enter the demodulation time you need The range is from 100 ms to 500 s In time domain the R S ZVH demodulates continuously i e the demodulation time is not relevant Controlling the volume Press the MARKER key Press the Marker Function softkey Select the Volume menu item The R S ZVH opens an input field to define the demodulation volume Enter the vo...
Page 164: ...curacy of the display line is 0 3 dB If you enter a value with a higher resolution the R S ZVH rounds that value You can also move the display line with the rotary knob or the cursor keys The step size for movement with the rotary knob is one pixel The step size for the cursor keys is 10 of the display range Press the LINES key Press the Display Line softkey The R S ZVH displays the display line a...
Page 165: ... limit line After turning on a limit line the R S ZVH checks if the signal violates the shape of the limit line If one or more signal levels exceed the limit value the R S ZVH features several indicators that the limit check has failed A general message in the diagram header that indicates if the signal violates the limit line including the trace that violates the limit An audio signal that sounds...
Page 166: ...horizontal line The difference is that the R S ZVH performs a limit check for threshold lines but not for display lines A failed limit check may be an issue if you want to create a measurement report because measurements with failed limits are not included in this report Using a display line you can use a line and are able to create a measurement report at the same time regardless if any limits ha...
Page 167: ...iolation on and off Press the Options softkey Select the Audio Beep menu item An X in front of the Audio Beep menu item indicates that the beeper is active If the audio beep is active the R S ZVH beeps each time a limit is violated Limit violation Note that a limit check fails only if the signal exceeds the limit line If the signal level is the same as the limit value the limit check passes ...
Page 168: ...ing the channel table the R S ZVH is set up according to the information contained in the channel table Instead of a center frequency the R S ZVH shows the currently active channel number including the name of the channel The center frequency of a channel is defined in the channel table and is the frequency corresponding to the selected channel Selecting a channel Entering a center start or stop f...
Page 169: ...the values is performed with the aid of a modified spline algorithm Even if only relatively few values such as maxima minima and turning points are available this algorithm can easily simulate the correction factors of common transducers Two transducers can be switched on at a time The second transducer must be assigned the unit dB The R S ZVH adds the two transducers to a total transducer Units s...
Page 170: ...ative unit dB as otherwise an addition would not be useful When you select a secondary transducer factor the dialog box shows only those transducer factors that have dB as their unit 4 4 1 Unit for Measurements with Transducers If the unit of the transducer is dB the units dBm dBmV or dBµV remain unchanged The linear units Volt and Watt are not permissible They are deactivated in the units menu If...
Page 171: ...H assumes the transducer values outside the defined range to be zero 4 4 4 Data Sets Containing Transducer Factors The R S ZVH stores data sets together with any transducer factors that may have been active for the measurement in question When such a dataset is recalled the associated transducer factor s are switched on as well Transducer factors recalled as part of a data set do however not appea...
Page 172: ...e measurement Press the MODE key Press the Power Meter softkey The R S ZVH activates the mode for power measurements Screen layout of the power meter mode 1 Connected power sensor model 2 Reference for relative power measurements 3 Power offset 4 Measurement time 5 Readout of the measured power 6 Analog readout of the measured power 7 Measurement frequency 8 Power sensor softkey menu A power senso...
Page 173: ... sensors you also need a passive USB adapter R S NRP Z4 to connect the power sensor to the R S ZVH For more information on the characteristics of the supported power sensors see the datasheet of the R S ZVH the website for R S power sensors http www2 rohde schwarz com en products test_and_measurement power_volt_meter NRPZ html ...
Page 174: ... up a connection via the interface and after a few seconds shows the measured power It displays the type of the power sensor in the display header If no power sensor has been connected or it is not connected appropriately the R S ZVH shows nothing If there are communication problems between the R S ZVH and the power sensor the R S ZVH displays one of the following error messages that indicate the ...
Page 175: ...Enter the frequency of the signal The R S ZVH transfers the new frequency to the power sensor which then corrects the measured power readings Zeroing the power sensor Offset voltages and currents have most effect on the power readout when measuring low powers You can compensate for these offsets by zeroing the power sensor Do not apply power during the zeroing process as the power sensor cannot di...
Page 176: ...nt result as the reference level It then displays the measured level relative to the reference level in dB The unit is automatically set to dB Rel Setting the averaging time The averaging time determines the length of the measurement The longer the averaging time the more stable the display particularly if signals have low power or are noisy The averaging time is either Short Normal or Long A shor...
Page 177: ... ZVH can take additional loss or gain between the DUT and the power sensor into account These are defined in terms of an offset in dB relative to the measured level A positive offset corresponds to a loss and a negative offset to a gain The R S ZVH shows the current offset in the diagram header Press the SCALE AMPT key Press the Ref Offset softkey The value entry box for the reference offset opens...
Page 178: ...urce reverse power The ratio of forward and reverse power is a measure of the load matching The R S ZVH displays the results as the return loss or the standing wave ratio Press the MODE key Press the Power Meter softkey The R S ZVH activates the mode for power measurements Screen layout of the power meter mode with a directional power sensor 1 Connected power sensor model 2 Selected transmission s...
Page 179: ... shows the way a test setup would look like The power sensors for the R S ZVH have an assymetrical design Hence you have to insert them into the test setup in such a way that the Forward arrow 1 2 on the sensor points toward the load in the direction of the power flux If the R S ZVH recognizes a power sensor it sets up a connection via the interface and after a few seconds shows the results It dis...
Page 180: ...wer sensor Connecting the RF connectors tightly Defining the center frequency To get the most accurate results you should synchronize the frequency to that of the signal Note that the R S ZVH maintains the center frequency that you have set in another operating mode In that case it uses that frequency as the power sensor frequency If you want to perform measurements on another known signal you can...
Page 181: ...ram header For more information see Setting the reference level Selecting a standard To ensure that true results are output when measuring modulated signals the R S ZVH offers the possibility of taking correction values into account for a number of common telecommunications standards Press the Standard softkey A menu to select a standard opens Select the required standard The R S ZVH takes the sel...
Page 182: ...e R S FSH Z14 or R S FSH Z44 a directional coupler or an attenuator has to be connected ahead of the power sensor In such cases the coupling attenuation of the directional coupler or the attenuation value of the attenuator are to be entered as positive dB values see above into the R S ZVH to ensure true measured power readout In both cases a termination or an attenuator of sufficient power handlin...
Page 183: ...channel power measurements without a power sensor is similar to measurements with a power meter The following features are available Defining the frequency Zeroing the measurement Selecting the unit Defining the reference level Taking additional loss or gain into account For more information see Performing and Configuring Measurements on page 160 Defining the channel bandwidth In addition you can ...
Page 184: ...rmal power meter application the pulse power application measures the power of the whole signal in the frequency range of the wideband power sensor Press the MODE key Press the Power Meter softkey Connecting the power sensor You can connect the wideband power sensors to the USB port of the R S ZVH For more information see Connecting a Power Sensor on page 159 The measurement starts as soon as the ...
Page 185: ... table 4 Numerical results showing the pulse characteristics 5 Diagram showing the pulse characteristics in a graphical format trace display 6 Measurement frequency 7 Scale of the x axis 8 Softkey menu of thze pulse power measurement application The following power characteristics are calculated and displayed as numerical values see also the figure below for a graphical representation of the param...
Page 186: ...he Pulse Width to Pulse Repetition Interval expressed as a percentage requires at least two measured pulses Start Time Time offset relative to the beginning of the trace 0 sec where the pulse begins start of the rise time Stop Time Time offset relative to the beginning of the trace 0 sec where the pulse stops end of the fall time Pulse Top Median pulse ON power The value of this parameter is used ...
Page 187: ...se top Similarly the level of the pulse base is calculated by the points representing the pulse base This algorithm is recommended for analyzing most of the pulse signals Integration Calculates the top power of the pulse by fitting a rectangle pulse of same energy into the pulse signal as a reference This algorithm is recommended for modulated pulse signals or when the pulse energy must be taken i...
Page 188: ...rent Press the MEAS key Press the Ref Power Config softkey Select either the Power or the Voltage menu item as the reference 5 4 2 2 Selecting the Video Bandwidth When you are using a wideband power sensor you can change the video bandwidth used for the measurement The main effect of using a small video bandwidth is that it reduces the displayed inherent noise Using a small video bandwidth thus in...
Page 189: ...ever you can also perform triggered measurements with the power sensor When you choose to do so the trigger event the moment when the actual measurement starts is either a rising slope in the signal or a falling slope Positive or Negative trigger Press the SWEEP key Press the Trigger softkey Select either the Positive or Negative menu item The R S ZVH stops measuring the signal until a trigger eve...
Page 190: ...it softkey Select the unit you prefer The R S ZVH adjusts the y axis accordingly 5 4 2 6 Scaling the Y Axis The functionality to scale the y axis is similar to that of the Spectrum application For more information see Setting a Display Range on page 127 5 4 2 7 Using Markers The Power vs Time diagram supports markers The functionality is similar to that of the Spectrum application For more informa...
Page 191: ...tics in both directions of the device under test DUT In addition to the magnitude of the transmistted and reflected power vector measurements also determine the phase characteristics of the DUT Although the accuracy of measurements is high in the default factory calibration the R S ZVH also provides all necessary calibration methods to correct the magnitude for these kinds of measurements and make...
Page 192: ...Bm in steps of 1 dB Press the SCALE AMPT key Press the TG Power softkey The R S ZVH opens an input field to set the output level The output power of the tracking generator is in the range from 40 dBm and 0 dBm Tracking generator output level Using an output level of 0 dBm or a receiver attenuation of 0 dB for S12 or S21 measurements can cause an overload at the RF input It is therefore recommended...
Page 193: ...sfully calibrate the test setup you have to connect the calibration standard at the reference plane usually the output of the RF measurement cable During calibration the R S ZVH removes systematic errors from the measurement This process is based on correction data it gets while performing the calibration The correction data for transmission measurements is based on the results of comparing the tr...
Page 194: ...information see Performing a Full 2 Port Calibration on page 46 Selecting a calibration kit To avoid phase errors you have to define the characteristics of the calibration kit you d like to use and then select the calibration kit in use The R S ZVH then corrects the measurement results accordingly You can either use one of the calibration kits specifically designed for use with the R S ZVH e g the...
Page 195: ...h is different it may cause additional phase error Some measurement setups may include additional cables or adapters that may have an additional electrical length To correct their phase error you can include the electrical length of additional test equipment The R S ZVH distinguishes if the equipment is connected to port 1 or port 2 Press the CAL key Press the Cal Settings softkey Select the Offse...
Page 196: ... the VSWR bridge the decisive factor of the quality of results is the quality of the calibration standards Because of the higher dynamic range vector measurements allow more accurate measurements of well matched DUTs at a higher display resolution Vector measurements also unlock more measurement formats and therefore provide more information from different perspectives about the DUT Supplying DC v...
Page 197: ...the MEAS key Press the Transmission S21 or Transmission S12 softkey for transmission measurements in forward or reverse direction Simultaneous display of several results You can also display two results simultaneously in a single diagram In that case the R S ZVH shows two traces with a different color in the result display Press the MEAS key Press the Other Meas softkey Select one of the result co...
Page 198: ...ition in both diagrams See also Working with the Dual Trace Mode Define the frequency parameters Before calibrating the measurement you should define the frequency parameters to avoid interpolation of the results Press the FREQ DIST key The R S ZVH opens an input field to set the center frequency Enter a frequency of 1950 MHz Press the FREQ DIST key Press the Span softkey The R S ZVH opens an inpu...
Page 199: ...ration e g the sweep time or detector or format e g view phase characteristics without affecting the accuracy of the measurement For more information see Selecting the Measurement Format on page 187 Note that for calibration to remain valid frequency parameters bandwidth and attenuation have to remain the same Depending on the calibration method you can also select other result displays e g reflec...
Page 200: ... PRESET key Connect the DUT Select the type of reflection measurement Press the MEAS key Press the Reflection S11 or Reflection S22 softkey for reflection measurements on port 1 or reflection measurements on port 2 Simultaneous display of several results You can also display two results simultaneously in a single diagram In that case the R S ZVH shows two traces with a different color in the resul...
Page 201: ...ey Select the appropriate calibration calibration on one or two ports Perform calibration For more information see Performing Calibration Reconnect the DUT The R S ZVH shows the results of the vector reflection measurement on the filter You can change the measurement configuration e g the sweep time or detector or format e g view phase characteristics without affecting the accuracy of the measurem...
Page 202: ...n in dB The diagram is a Cartesian diagram with a logarithmic vertical axis The horizontal axis represents the measured frequency range The magnitude format is the default format for all measurements Available for all measurements Phase Shows the phase characteristics of the DUT in degrees The diagram is a Cartesian diagram with a linear vertical axis The horizontal axis represents the measured fr...
Page 203: ...reflection coefficient Press the FORMAT SPAN key Press the Format Settings softkey Select the rho or mrho menu item Available for vector reflection measurements Smith chart Shows the measurement results in the Smith chart The Smith chart is a circular diagram that primarily shows impedance or reflection characteristics of a DUT Available for vector reflection measurements For more information see ...
Page 204: ...gth needs to be specified only for non dispersive DUTs in which phase delay and group delay match Due to the significantly wider aperture the measurement certainty is an order of magnitude higher in the phase delay measurement than in the group delay measurement The result for the electrical length is correct only if the phase difference between two adjacent test points does not exceed 180 Availab...
Page 205: ...ntrol the zoom function It also draws a rectangle on the display that corresponds to the parts of the display about to be zoomed in The size of the rectangle depends on the zoom factor Press the Zoom Factor softkey Select the menu item with the zoom factor you want The R S ZVH adjusts the size of the rectangle By default the position of the rectangle is the area in the center of the display You ca...
Page 206: ...l marker output formats dB Magnitude Phase Shows the magnitude in dB and the phase at the current marker position Lin Magnitude Phase Rho Shows the converted magnitude in and the phase in rho at the current marker position Real Imag Rho Shows the real and imaginary components at the current marker position R jX Shows the real and imaginary components of the impedance at the marker position The ima...
Page 207: ...mpedance Press the MARKER key Press the Marker Mode softkey Select the Ref Impedance menu item The R S ZVH opens an input field to select the reference impedance Enter the reference impedance you need The value range is from 1 mΩ to 10 kΩ 6 3 1 2 Working with the Dual Trace Mode When performing measurements it is possible to perform and display two measurements simultaneously After activating this...
Page 208: ... active trace Only the active trace can be configured while the other is passive To activate trace 2 press the Select Trace softkey in the trace menu When pressing the Select Trace softkey the R S ZVH switches between trace 1 and 2 The trace indicator shows the currently active trace After selecting trace 2 you can set the measurement parameters for trace 2 while the first trace is passive Note th...
Page 209: ... 0 dB and its position is the grid line at the top of the diagram The reference value only changes the 0 dB reference without actually attenuating or amplifying the signal level When changing the reference value make sure that you do not overload the R S ZVH As long as the trace is completely within the diagram area and the reference position at the top of the diagram the risk of an overload is el...
Page 210: ...he value range the vertical axis covers The default display range depends on the measurement format For more information see Selecting the Measurement Format on page 187 When you change the display range the reference value and position remain the same Merely the scale of the vertical axis is compressed or expanded Press the SCALE AMPT key Press the Range Ref Pos softkey Select the display range y...
Page 211: ...rking with Channel Tables The R S ZVH allows you to use channel tables in network analyzer mode Press the FREQ DIST key Press the Signal Standard softkey Select the signal path you need from the menu The R S ZVH opens the list of channel tables loaded into the R S ZVH via R S ZVHView Select the channel table you need The R S ZVH scans the channel table for the channels with the lowest and highest ...
Page 212: ... lines with the R S ZVHView software and load them into the R S ZVH via the USB or the LAN interface The number of limit lines the R S ZVH can store in its memory depends on the number of other data sets on the R S ZVH For more information see Managing Datasets on page 27 und Using Limit Lines on page 150 6 3 6 Using Trace Mathematics Trace mathematics that subtract one trace from another are avai...
Page 213: ...nerates an unmodulated sinewave signal on a single frequency Typical applications for a vector voltmeter are adjustment of the electrical length of cables with a reflection measurement testing of the antenna elements of a phase controlled antenna array relative to a reference antenna with a transmission measurement Press the MODE key Press the Vector Voltmeter softkey The R S ZVH starts the vector...
Page 214: ...ibrating Measurements on page 178 6 4 2 Performing Measurements With the vector voltmeter you can measure the reflection on port 1 and the transmission in reverse direction The example included here is based on a transmission measurement of a two port filter The filter works in the frequency from of 1920 MHz to 1980 MHz Select the type of reflection measurement Press the MEAS key Press the Reflect...
Page 215: ...he R S ZVH shows the characteristics of the DUT magnitude and phase as numerical values 6 4 2 2 Performing Reflection Measurements Calibrate the measurement for reflection measurements Press the CAL key Press the Full 1 Port softkey for calibration on port 1 Perform calibration For more information see Performing Calibration Reconnect the DUT The R S ZVH shows the characteristics of the DUT magnit...
Page 216: ... the MEAS key Press the Ref softkey The R S ZVH saves the results that it got prior to pressing the softkey as the reference result for future measurements The results show the difference of the current measurement and the reference measurement The unit for reference measurements is always dB The reference measurement results are always displayed below the current measurement results for better or...
Page 217: ... overview of all instrument functions in the form of softkey and menu overviews 7 1 General Functions General functions are those that are available for all operating modes 7 1 1 General R S ZVH Setup The SETUP key opens the setup menu that contains functionality to set up the R S ZVH in general and functionality to set up the measurement ...
Page 218: ...946 12 09 203 7 1 2 File Management The SAVE RECALL key opens the file manager that contains functionality to manage datasets and other files 7 1 3 Operating Mode Selection The MODE key opens the mode menu that contains functionality to select the operating mode of the R S ZVH ...
Page 219: ...opens the frequency menu that contains functionality to set up the horizontal axis of the measurement diagram The contents of the frequency menu depend on the measurement you have currently selected This is what the frequency menu looks like for distance to fault measurements This is what the frequency menu looks like for reflection transmission and cable loss measurements 7 2 2 Amplitude Paramete...
Page 220: ... Sweep Configuration The SWEEP BW key opens the sweep menu that contains functionality to set up and trigger the sweep 7 2 4 Markers The MARKER and MKR keys open the marker menu and marker to menu that contain functionality to use markers This is what the marker menu looks like This is what the marker to menu looks like ...
Page 221: ... that contains functionality to select and configure the measurement Transmission S21 is available only if you have installed option R S ZVH K39 7 2 6 Measurement Format Selection The FORMAT SPAN key opens the span menu that contains functionality to select the measurement format 7 2 7 Measurement Calibration The CAL key opens the calibration menu that contains functionality to calibrate the R S Z...
Page 222: ...ectrum Analyzer R S ZVH K1 This section contains all softkeys and menus that are available in spectrum analyzer mode 7 3 1 Measurement Selection The MEAS key opens the measurement menu that contains functionality to select and configure the measurement The spectrogram is available only if you have installed option R S ZVH K14 Channel Power ...
Page 223: ... and Softkey Overview Functions of the Spectrum Analyzer R S ZVH K1 Operating Manual 1309 6946 12 09 208 Occupied Bandwith TDMA Power Spectrum Emission Mask Spurious Emission Harmonic Distortion AM Modulation Depth ...
Page 224: ...46 12 09 209 Spectrogram Spectrogram Playback 7 3 2 Frequency Parameters The FREQ DIST key opens the frequency menu that contains functionality to set up the horizontal axis of the measurement diagram 7 3 3 Span Selection The FORMAT SPAN key opens the span menu that contains functionality to set the span ...
Page 225: ...the amplitude menu that contains functionality to set up the vertical axis of the measurement diagram 7 3 5 Sweep Configuration and Bandwidth Selection The SWEEP BW key opens a menu that contains all functionality to configure the sweep including the bandwidths 7 3 6 Trace Functionality The TRACE key opens the trace menu that contains functionality to set up the traces ...
Page 226: ... 1309 6946 12 09 211 7 3 7 Display and Limit Lines The LINES key opens a menu that contains the functionality to control display and limit lines 7 3 8 Markers The MARKER and MKR keys open a menus to control markers and use marker functions Softkey in the Marker Menu Softkeys in the Marker To Menu ...
Page 227: ...lyzer functionality is available only with option R S ZVH K42 7 4 1 Measurement Configuration The MEAS key opens the measurement menu that contains functionality to select and configure the measurement 7 4 2 Frequency Parameters The FREQ DIST key opens the frequency menu that contains functionality to set up the horizontal axis of the measurement diagram 7 4 3 Measurement Format Selection The FORM...
Page 228: ...ntains functionality to set up the vertical axis of the measurement diagram 7 4 5 Sweep Configuration The SWEEP BW key opens a menu that contains all functionality to configure the sweep 7 4 6 Trace Functionality The TRACE key opens the trace menu that contains functionality to set up the traces 7 4 7 Limit Lines The LINES key opens a menu that contains the functionality to control limit lines ...
Page 229: ...Functions of the Network Analyzer R S ZVH K42 Operating Manual 1309 6946 12 09 214 7 4 8 Markers The MARKER and MKR keys open a menus to control markers and use marker functions Softkey in the Marker Menu Softkeys in the Marker To Menu ...
Page 230: ...oltmeter Measurements The MEAS key opens a menu that contains the functionality to configure measurements with the vector voltmeter 7 5 2 Frequency Parameters The FREQ DIST key opens a menu that contains the functionality to set the frequency 7 5 3 Amplitude Parameters The SCALE AMPT key contains functionality to configure level parameters 7 5 4 Sweep Configuration The SWEEP BW key opens a menu th...
Page 231: ...nu and Softkey Overview Functions of the Vector Voltmeter Operating Manual 1309 6946 12 09 216 7 5 5 Trace Functionality The TRACE key opens the trace menu that contains functionality to set up result evaluation ...
Page 232: ...tains all softkeys and menus that are available in power meter mode 7 6 1 Power Meter Measurements The MEAS key opens a menu that contains the functionality to configure measurements with the power meter Power Meter Directional Power Meter 7 6 2 Frequency Parameters The FREQ DIST key opens a menu that contains the functionality to set the frequency ...
Page 233: ...perating Manual 1309 6946 12 09 218 7 6 3 Amplitude Parameters The SCALE AMPT key contains functionality to configure level parameters 7 6 4 Sweep Configuration The SWEEP BW key opens a menu that contains functionality to configure the sweep Pulse Power Measurements ...
Page 234: ...ine wave a square wave with a certain on off ratio or a sawtooth wave However detecting superimposed low level signals or monitoring the harmonic content of the signal is easier with a spectrum or signal analyzer Figure 8 1 shows the theoretical basis of the two measurement methods In the time domain an oscilloscope would for example show a section of the signal that is a square wave The same sign...
Page 235: ...raphically shows the mixing process For models with a frequency limit of 3 6 GHz the IFs are 4892 8 MHz 860 8 MHz and 54 4 MHz The conversion from a specific input frequency to the first IF is done by a local oscillator LO This LO can be tuned from 4 8 GHz to 8 4 GHz All other conversions are handled by single frequency oscillators In case of models with a frequency limit of 8 GHz the IFs are 8924...
Page 236: ...ctor is referred to as the video signal As it has been demodulated it only contains amplitude information The phase information is lost With RF sine signals the video signal is a DC voltage With AM signals the video signal contains a DC component whose amplitude corresponds to the carrier power and an AC component whose frequency is equal to the modulation frequency provided the modulation frequen...
Page 237: ...tor which simultaneously displays the maximum peak and the minimum peak is usually also provided The Fig below explains how these detectors work The figure above shows 30 measured values which are represented by a single pixel The peak detector determines and displays the maximum measured value The Auto Peak detector takes the maximum and minimum and displays them together The two values are joine...
Page 238: ...surements on modulated signals However the display range should be chosen so as not to exceed 100 times the bandwidth of the signal or the resolution bandwidth whichever is larger The sample detector or the RMS detector preferred should be used for noise measurements Only these two detectors are capable of measuring noise power correctly When measurements are made on sine signals the level display...
Page 239: ...Cable tests 37 Calibration 44 178 199 procedure 179 state 178 Calibration kit 44 178 179 Calibration method 178 Calibration procedure 46 Center frequency 52 122 160 165 CF step size 122 Channel bandwidth ACLR 94 channel power 81 occupied bandwidth 85 Channel power 79 adjust level 80 channel bandwidth 81 display mode 82 reference level 80 span 81 standard 80 unit 82 Channel spacing 94 Channel table...
Page 240: ... Max hold 140 Max peak 141 Measurement 134 ACLR 90 AM modulation depth 104 audio demodulation 147 cable loss CAT 41 channel power 79 directional power sensor 165 distance to fault 40 electrical length 188 frequency counter 146 group delay 188 harmonic distortion 102 isotropic antenna 120 magnitude 187 n dB down 146 noise power density 145 occupied bandwidth 83 phase 187 power sensor 160 reflection...
Page 241: ...Reference position 55 126 194 Reference value 54 194 Reflection 39 Resolution bandwidth 131 134 Result table spectrum emission mask 101 spurious emission 107 RF attenuation 128 RMS 142 Rotary knob 11 Sample 142 Save on event 18 Scaling 54 127 195 horizontal axis 122 Screen layout 8 ACLR 90 AM modulation depth 104 CAT mode 38 channel power 79 file manager 29 harmonic distortion 102 measurement wiza...
Page 242: ...tion depth 105 Time domain 87 125 135 Time line 115 Total harmonic distortion 103 Trace 140 Trace second 143 Trace average 140 Trace mathematics 144 Trace memory 144 Trace mode 60 140 Trace selection 143 Tracking generator 177 Tracking generator power 55 Transducer 130 154 unit 155 Transmission CAT 42 Transmission channel 93 Trigger 59 135 Trigger delay 136 Trigger level 137 Unit 127 channel power...